Table of Contents
Executive Summary
Key Findings
Introduction
Background
Methodology and Research
I. Health
II. Productivity Loss
III. Crime, Law Enforcement, & Criminal Justice
IV. Research and Prevention
V. Fires
VI. Public Assistance and Social Services
VII. Traffic Collisions
VIII. Intangible Costs
Cost of Treatment Vs. Non Treatment
References
Complete Form to download PDF
Executive Summary
We calculated the total economic cost from alcohol and drug abuse in the United States in 2016. Using methods from earlier studies, we updated values with the most current data. Where data was not available, we used proxies, such as inflation and abuse use rates, to update outdated values.
Drug and alcohol use in the United States costs $1.45 trillion in economic loss and societal harm annually. This includes $578 billion in economic loss and $874 billion dollars in societal harm through quality of life adjustment and premature loss of life.
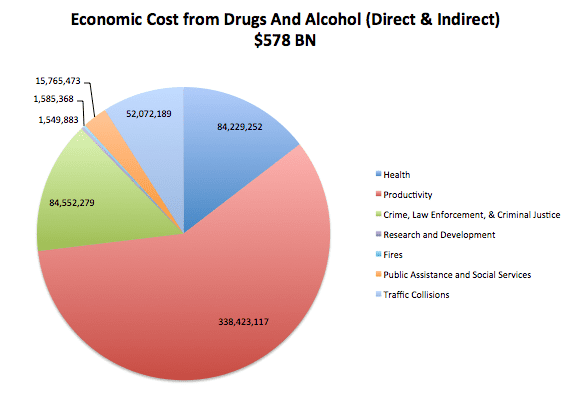
Figure 1: $578 Billion in Economic Cost
| Costs | Cost(in Thousands) | Double Counting Adjustment (12.29%) | % of Direct + Indirect | % of Total |
| Health | 96,034,026 | 84,229,252 | 15 | 5.8 |
| Productivity Loss | 385,853,292 | 338,423,117 | 59 | 23.3 |
| Crime, Law Enforcement, Criminal Justice | 96,402,325 | 84,552,279 | 15 | 5.8 |
| Research and Prevention | 1,767,099 | 1,549,883 | 0.27 | 0.11 |
| Fires | 1,807,558 | 1,585,368 | 0.27 | 0.11 |
| Public Assistance and Social Services | 17,975,012 | 15,765,473 | 2.73 | 1.09 |
| Traffic Collisions | 59,370,133 | 52,072,189 | 9.01 | 3.58 |
| Direct & Indirect Subtotal | 659,209,446 | 578,177,561 | 100 | 40 |
| + Intangible Costs (Quality of Life Lost) | 997,007,245 | 874,452,302 | 151 | 60 |
| Direct, Indirect, Intangible Total | 1,656,216,692 | 1,452,629,863 |
Table 1: Economic Cost due to Drug and Alcohol Abuse
Figure 2: $1.45 Trillion in Economic Cost with Societal Harm
Key Findings:
- Cost of Treatment versus No Treatment – The avoidable cost per substance abuser was $13,500 and $34,000, if intangible costs are considered. The cost of treatment is $11,600 per user. If everyone in the US who needs substance abused received treatment, it would come at a cost of $224 billion. Treatment of substance abuse to all users results in $368 billion in savings due to avoided direct, indirect, and intangible costs. These values result in a $142 billion dollar economic gain to society.
- Health Care Costs – Treatment and hospital costs total $66 billion, or over 78% of the entire health care costs. When compared to other studies, our estimation is at the higher end of the comparable range. However, many of these studies were completed before the opioid crisis. The diversity in ranges are attributed to public versus private hospital costs, cost of treatment assumptions, and the data sets used. Cost in drug abuse and alcohol are substantially higher now as compared to previous studies.
- Productivity – Productivity makes up the largest percentage of total costs (23%). The vast majority of the $338 billion is due to diminished productivity and premature death. The value of human life and earnings potential have a large impact on the overall value.
- Crime – Law enforcement and corrections make up more than 90% of the economic costs of crime. Values from this section should be taken with suspicion, as the attribution values used are nearly 15 years old. Given the rapid changes in criminal justice towards non-violent drug offenses over the last decade, this number may be outdated.
- Traffic – 22% of all traffic costs can be attributed to alcohol, which totals to over $50 billion dollars in economic cost. This value does not address drugs and therefore is likely undervalued.
- Intangibles – At over $900 billion, intangibles cost more than 1.5 times more than the direct and indirect costs. This is primarily due to the Value of Statistical Life (9.4 million per life) and due to the 94,000 lives that were lost to drug and alcohol use in 2015.
Introduction:
In December of 2016, the Surgeon General published the “Report on Drugs, Alcohol and Health” in which he states that drug and alcohol use costs the US $442 billion annually (Surgeon General 2016). This monumentally large figure was heavily reported in the news media (NPR 2016, US News 2016). Upon closer inspection, this number has proven to be outdated and inaccurate. The report cites two economic studies, one on alcohol and one on drugs, and adds them together. The alcohol analysis was a 2015 study using 2010 data (Sacks 2015) while the drug report was a 2011 study using 2007 data (NDIC 2011). This is well before the opioid crisis was in full force. This haphazard summation ignores all co-morbidities associated with drug and alcohol use. It ignores the shared fixed costs of prevention, treatment, and research of substance abuse. It is our belief that policy makers, health care providers and insurers, and taxpayers need to know the true cost of drug and alcohol in the United States. This report intends to give a more realistic analysis of this essential question.
Background:
The economic cost of drug and alcohol use in the US has been well studied but infrequently updated. The Executive Office of the President’s Office of National Drug Control Policy (ONDCP) contracted an economic analysis of the cost of drug abuse in the United States in 1988, 1992, 1998, and 2002. Most recently, the now defunct National Drug Intelligence Center (NDIC) determined in 2011 that the economic cost of drugs to was $193 billion in 2007 (NDIC 2011). The Lewin group, contracted by the Center of Disease Control (CDC), estimated the economic cost of alcohol use in 2006. This methodology was later updated in 2015 using 2010 statistics. The updated report found that the cost was $249 Billion (Lewin 2013, Sacks 2015). It was these two values, $193 and $249 billion, that the Surgeon summed to determine the cost of drugs and alcohol in the US was $442 billion.
The question of economic cost to drug abuse is determined by a Cost of Illness (COI) study. COI is a well documented framework which allows policy makers to monetize the consequences of diseases and enables its impact to be gauged against other social problems (Rice 1967, Akobundenn et al 2006, Clabaugh and War 2008, Hugson and Meiners 1982). There are several methods to conduct a COI for substance abuse. Early researchers studied three substances: drugs, alcohol, and tobacco. More recently, studies have focused on just one substance at a time (either drugs or alcohol) (Lewin 2013, NDIC 2011). Now, with the prevalence of outbreaks in drug use such as opioids, studies have focused on solely one type of drug, such as the 2016 study “The Economic Burden of Prescription Opioid Overdose, Abuse, and Dependence in the United States, 2013” (Birnbaum 2011, Florence 2016).
Each research team has slightly different methods for evaluation. Most assess the cost of health, productivity, and crime. But the cost components and methodology of calculation within these groups vary between studies. These variances can be due to data availability, assumptions, or philosophical differences of the authors.
Key philosophical differences rest with four central questions. How does the author define public costs? How does the author value a life? How do we define attribution? Do we consider pain and suffering and other intangible costs (Moore 2005)?
The public versus private costs is a debate centered on whether or not a substance abuser is a fully informed, rational, economic actor. Some economists argue that if a substance abuser bears the cost of his or her decision, it is not a cost to society (NDIC 2011). Others argue that since substance abuse affects rational decision-making and the abuser may not internalize the entire cost of his decisions, costs born privately should be considered a social cost (Harwood 1998, Collins and Laspey 2002, Collins 2006). This primarily affects public versus private health insurance. While less of a problem in European studies, it is a significant decision for researchers in the US as the US market relies heavily on private insurance. This study sides with the logic that all medical costs, whether private or public, should be considered a cost to society.
Valuing a human life can either be done using the human capital, demographic, or willingness to pay approach (Health Econ 2017). The human capital approach looks at the future earnings of an individual through the course of his life and discounts them to find a net present value of market worth. This is the conservative economic value of a life. The demographic approach is retrospective, looking at what earnings could have been achieved by comparing them to a similar part of society not affected by the disease. The Willingness to Pay approach internalizes the price someone is willing to pay to have a lower probability of dying (NDIC 2011, Collins and Lapsey 2006). The willingness to pay approach provides an approximation of the intangible costs, including pain and suffering of loved ones, attributable to death. The willingness to pay method is used by government agencies in the US and provides a Value of a Statistically Life that is many times larger than the two economic approaches. We use the human capital approach to value a life for the direct and indirect costs and the difference between the Willingness to Pay approach and human capital approach for the estimation of intangible costs.
The question of attribution considers the allocation of avoidable costs. That is, are we trying to determine what the economic status would be if substance abuse never existed, if substance abuse stop existing today, or if we could mitigate the realistically avoidable costs associated with substance abuse (Collins and Lapsey 2002)? This question is more philosophical than economical. We present the total cost of substance abuse on society and recommend further studies to look at the avoidable costs that could be mitigated through prevention and treatment.
Lastly, the question of pain and suffering and other intangible costs is an essential criticism of COI studies (Collins 2006, Moore 2005). Many studies ignore intangible costs of substance abuse in the US. Given the magnitude of intangible costs due the quality of life lost to those suffering, we believe it is essential to try to quantify these costs monetarily. We recognize the difficulty and potential inaccuracies associated monetizing intangible costs.
Methodology and Research
After conducting a survey of over 50 studies, we identified 10 commonly cited reports and compared their cost categories and sub components to develop a list of costs to be included in our research.
Once the cost categories were identified, we used the most replicable study for each cost category. Most of these categories required updating numbers with the most recent results from government agencies. For sub-categories that have large cost contribution relative to the costs as a whole, we used proxies from other methodologies to cross check the values and ensure that we were within a reasonable range.
| Report/Agency/State | Name | Year | Data Year |
| Alaska | The Economic Cost of Drug Abuse in Alaska, 2016 Update | 2017 | Varies |
| Surgeon Generals Report | Facing Addiction in America – The Surgeon General’s Report on Alcohol, Drugs, and Health | 2016 | Varies |
| The Lewin Group | Economic Cost of Excessive Alcohol Consumption in the US, 2006 | 2013 | 2006 |
| Maine | The Cost of Drug and Alcohol Use in Maine, 2010 | 2013 | 2010 |
| Department of Justice: National Drug Intelligence Center (NDIC) | Economic Impact of Illicit Drug Use on American Society | 2011 | 2007 |
| Executive Office of the President: Office of National Drug Control Policy | The Economic Costs of Drug Abuse in the United States 1992–2002 | 2004 | 2002 |
| Health Canada | International Guidelines for Estimating the Avoidable Costs of Substance Abuse | 2006 | NA |
| Carnegie Mellon | How Studies of the Cost-of-Illness of Substance Abuse Can be Made More Useful for Policy Analysis | 2005 | NA |
| World Health Organization | International Guidelines for Estimating the Cost of Substance Abuse | 2003 | NA |
| Australia | Counting the Cost: estimates of the social costs of drug abuse in Australia in 1988-9 | 2003 | NA |
Table: Summary of Lit Review to Determine Cost Categories and Components
I. Health
Summary
| Health | Cost in Thousands | Double Counting Adjustment | % of Total |
| Hospital | 44,138,460 | 38,712,836 | 46% |
| Other Costs | 12,708,243 | 11,146,110 | 5% |
| Specialty Diseases | 3,282,166 | 2,878,713 | 3% |
| Treatment | 31,137,102 | 27,309,641 | 32% |
| Health Insurance Administration | 4,741,716 | 4,158,851 | 5% |
| Crime Victim Health Care Costs | 26,338 | 23,101 | 0% |
| Subtotal | 96,034,026 | 84,229,252 | 15% |
Table 3: Health Costs
Health costs make up 15% of the total direct and indirect costs associated with substance abuse, totaling $84 Billion in economic loss. The largest drivers of cost are the costs associated with hospitals and treatment, totaling nearly 78% of the total health costs. We bracketed our estimation by considering the inflation-adjusted values from the Lewin and NDIC study and extrapolated the costs from the Maine study (Lewin 2013, NDIC 2011, BLS 2017, Maine 2013).
| Hospital Costs Triangulation (in Thousands) | ||
| Low Estimate | Our Value | High Estimate (Maine) |
| $50,313,711 | $84,229,252 | $85,318,452 |
The bracketed range of health costs was $50-85 billion. We recognize that our valuation is on the higher end of this spectrum, but since the lower estimation is based off reports conducted pre-opioid crisis, that is to be expected. The wide range of differences can be explained by the metrics used for hospitalization visits, public versus private costs, and the costs associated with treatment.
Methodology and Background
Hospital costs are typically divided into inpatient and outpatient costs (Harwood 1994 1998, ONDCP 2001, 2004, Lewin 2013, NDIC 2011). We replicated the NDIC methodology with a few modifications. The NDIC method consists of finding the total number of inpatient and outpatient hospital visits due to drugs and drug-attributable diseases such as hepatitis, HIV, and tuberculosis. They then apply the cost of these visits to determine a total cost due to drug use. We updated and adjusted these numbers.
First, we used the Drug Abuse Warning Network (DAWN) to determine the number of ER visits and hospital admissions attributable to drugs and alcohol. The most recent data provided by DAWN was from 2011 (DAWN 2016). Therefore, we adjusted these numbers by using growth rates from substance abuse, substance abuse treatment, overdose deaths, and DAWN ER reports. The analysis from those growth rates resulted in a 4% growth per year from 2011-2016 (SAMHSA 2017, CDC Wonder 2017). HIV and tuberculosis reports were kept the same as the 2007 NDIC values. Hepatitis C was adjusted to reflect the CDC growth rate of new cases (CDC 2017). The decision to use the same values as 2007 for HIV and Tuberculosis was fairly arbitrary. The relatively small magnitude of these costs coupled with the fact that these are relatively stable conditions in US society justifies this conservative assumption.
The costs of hospitalization and emergency department visits used in the 2011 NDIC report were inflated from 2007 dollars to 2016 dollars using the Bureau of Labor Statistics’ Medical Services Consumer Price Index (CPI-MS) (BLS 2017, Harwood 2002, ONDCP 2004). We then multiplied the number of cases by the cost per case to determine the total value in each category. These values were summed to determine the total hospital costs.
Our analysis found that hospitalization costs were $28 billion for inpatient and $9 billion for outpatient. The process is detailed in tables 5 through 7.
| Cost Per Event Hospital and ER Event | |||||||||
| Hospitalization | Number of Events** | 2016 Adjustment (Calculated Below) | 2016 Values | Attribution*** | Attributable Events | Value in 2007 Dollars | Inflation Adjustment | 2016 Dollars | Cost Total |
| Illicit Drug Use | 1,191,936 | 1.20 | 1,429,402 | 1 | 1429402.083 | 16588 | 1.33 | 22042.49149 | 31,507,583,235 |
| Hepatitis B | 1444 | 1 | 1,444 | 0.181 | 261.364 | 38131 | 1.33 | 50669.29363 | 13,243,129 |
| Hepatitis C | 6352 | 1 | 6,352 | 0.162 | 1029.024 | 32955 | 1.33 | 43791.31341 | 45,062,312 |
| HIV | 43393 | 3.16 | 137,182 | 0.213 | 29219.74574 | 32445 | 1.33 | 43113.61443 | 1,259,768,852 |
| Tuberculosis | 3707 | 1 | 3,707 | 0.048 | 177.936 | 81078 | 1.33 | 107738.1917 | 19,170,50 |
| Other | 0.029 | 28127 | 1.33 | 37375.76308 | – | ||||
| 32,844,828.03 | |||||||||
| Emergency department | |||||||||
| Illicit Drug Use | 3,433,636 | 1 | 4,117,709 | 1 | 4117709.425 | 2064 | 1.33 | 2742.687631 | 11293590707 |
| HIV | 6904 | 1 | 6,904 | 0.002 | 13.808 | 2263 | 1.33 | 3007.123115 | 41522.35597 |
| Other | 1471 | 1.33 | 1954.696466 | 0 | |||||
| 11,293,632.23 |
Table 5: Cost of Hospitalization and ER visits associated with Substance Abuse
| PROXY: | 2011 | 2016 | Years | Growth Rates |
| SAMHSA Data in Treatment | 2300000 | 2229000 | 5 | -1% |
| SAMHSA Data Substance Abuse | 22112 | 20959 | 5 | -1% |
| # of Overdose deaths* | 41340 | 52404 | 4 | 6% |
| DAWN ER DATA | 2004 | 2011 | Growth Rate | |
| Average YoY Growth Since 2005 | 2,537,722 | 5,067,374 | 7 | 10% |
| Average of Averages | 4% |
Table 6: Growth of Overdoses and ER Visits
| # of New Cases in 2005 | # of new Cases in 2014 | # years | CAGR | 2007-2016 Adjustment |
| 694 | 2194 | 9 | 13.6% | 3.16 |
Table 7: Hepatitis C Adjustment
Analysis:
The DAWN reports use an order of magnitude larger number than that used by NDIC. The NDIC methodology uses metadata from the National Emergency Department Statistics (NEDS) and National Admissions Statistics (NAS). The 35 million data points were sorted using the International Classification of Diseases-Revision-9 (ICD-9) (NEDS 2017, NAS 2017, SAMHSA 2017). Their results find roughly 200,000 drug related ED visits and 76,000 hospitalizations (NDIC 2011).
In comparison, we used the DAWN report, which had 1.1 million drug and alcohol hospitalizations and 3.4 million ED visits. This discrepancy can be explained in two parts. First, NDIC only considered drugs and not drugs and not alcohol. Second, NDIC only considered public payers. As previously discussed, the latter is a point of contention in COI studies for substance abuse. Many argue that only public payers should be considered, for the role of the COI is to look at the cost to society as a whole and those who have private insurance or pay out of pocket are bearing the cost of substance abuse internally and therefore should be ignored (NDIC 2011). Other economists argue that informed, rational actors who understand the costs and benefits of their actions are required for decision costs to be borne privately. Given that substance abuse affects decision making and the costs may not be fully realized to a user, economists argue that all health costs should be considered social costs (Harwood 1998, Collins and Lapsey 2002). Our analysis sides with this broader, more inclusive argument.
DAWN encompasses the proper ICD codes that are attributable to drugs and alcohol, but that does not fully encompass the total hospitalization costs to substance abuse. In interviews with health professionals, we found that many studies understate the medical cost because of the difficulty to apply attribution to drugs or alcohol. By way of example, if a substance abuser requires surgery, the outcome of that surgery will likely be worse than a non-substance abuser. The cost of worst outcomes or the follow up visits required will not be coded as a drug induced event even though the only reason the outcome was poor was due to their substance abuse.
| Hospital Costs Triangulation (in Thousands) | ||
| Low Estimate | Our Value | High Estimate |
| $20,055,265 | $44,138,460 | $65,282,926 |
Table 8: Triangulation
We bracketed our estimation by using assumptions that generate low value and high value hospital costs. The inflation adjusted values for the Lewin’s 2006 report on Alcohol and the 2007 report on drugs yields health care costs of $20 billion, less than half of our projected value. This can be attributed to the discrepancy of DAWN and NAS/NEDS datasets. Maine’s Substance Abuse and Mental Health Services’ 2013 report “The Cost of Drug and Alcohol Abuse in Maine, 2010” (Maine) has a value of $267.66 million for hospitalization costs of drug and alcohol in Maine (Maine 2013). Given that Maine has .0041% of the population, this value provides a $65 billion cost across the US.
Other Costs
Other costs consist of costs attributed to ambulances, prescription drugs, nursing homes, and other health professional/durable goods.
| Other Costs | Cost in Thousands | Double Counting Adjustment | % of Health Total |
| Ambulance | 2,243,421 | 1,967,654 | 2% |
| Prescription Drugs | 8,343,451 | 7,317,851 | 9% |
| Nursing Homes | 1,254,400 | 1,100,206 | 1% |
| Other Health Professional,Durable Goods | 866,970 | 760,400 | 1% |
| Subtotal | 12,708,243 | 11,146,110 | 5% |
Table 9: Other Costs
Ambulances:
Methodology
The Department of Health and Human Services (HHS) submitted a report to congress in 2015 on the cost of Medicare payments to ambulances in 2011 (HHS 2011). This value served as a proxy for the total amount of public money towards ambulance rides. A John’s Hopkins Study stated that 40-60% of all ambulance rides in Baltimore were attributable to drugs or alcohol (Hopkins 2016). Taking 40% of the inflation adjusted HHS value, we found the costs of drug and alcohol to ambulances to be $1.97 Billion.
Analysis
This method is very conservative. First, it is only considering Medicare payments to ambulances, a small percentage of the total ambulance visits in this country. Second, we used Johns Hopkins’ 40% rate over their 60% rate. Lastly, in interviews with health professionals, we found that the increasing use of Narcan has increased the ambulance costs per visit in drug overdoses and decreased hospital costs. The passing of costs from hospitals to first responders would indicate that the 2011 value may be undervalued.
Prescription drugs:
Methodology
We replicated Maine’s methodology. Maine cites the National Institute on Drug Abuse’s claim that 2.2% of prescription drugs can be attributed to disease and injuries related to substance abuse (Maine 2013). We used the attributable faction of 2.2% to Kaiser Family Foundations’ analysis of US spending on prescription drugs to find a total cost of $8.34 billon (Kaiser 2017).
Analysis
Prescription drugs make up less than 1% of the total economic cost of substance abuse. We could not verify that the primary source “The Economic Costs of Alcohol and Drug Abuse in the United States – 1992” (Harwood 1994) stated the 2.2% attribution percentage, but we feel confident in its use for two reasons. First, the number is only attributing alcohol. Second, the opioid crisis is highly dependent on drug over-prescription and prescription misuse. In 2015, 12.5 million people misused opioid prescriptions (CDC 2017). With the recognition that the 2.2% is from 1992 and that the opioid crisis has only increased, we believe that $8 billion is not only realistic but may even underestimate the true cost. We feel comfortable in its inclusion but are suspect of its accuracy.
Nursing Homes:
Methodology
We replicated Maine’s methodology. Maine cites the 1985 Survey from the National Nursing Home Survey, which found that 1% of nursing home costs are attributable to alcohol abuse (Maine 2013). We use an attribution fraction of 1% of the nursing home costs from the Center for Medicare/Medicaid Services (CMS) Health Expenditure Data on Nursing Home costs. It should be noted that this estimate is only for alcohol and is likely significantly lower than drug and alcohol combined.
Analysis
The fact that the survey is from 1985 is troubling, but we include it for two reasons. First, its attribution is only for alcohol and not alcohol and drugs and therefore it is inherently conservative. Second, it is of small consideration, less than one thousandth of the total cost. Therefore, any cost of inaccuracies in this number will not throw off the entire value and are offset by the benefit that comes from including this cost category.
Other health professional/durable goods:
Methodology
We replicated Lewin’s methodology. Lewin’s report on the Economic Cost of Alcohol estimates that 0.39% of all ambulance visits that are not reported as due to alcohol are actually attributable to alcohol (Lewin 2013). We used the .39% attributable fraction on the CMS Heath Expenditure Data on other health professionals and durable goods (CMS 2017). We found costs to be $866 million. It should be noted that this estimate is only for alcohol and is likely significantly lower than drug and alcohol.
Analysis
The fact that this is a small value relative to the total cost gives little consideration to this category. According to Lewin, the intent of this is to capture the hospital expenditures that would have not been categorized as attributable to alcohol. It is difficult to say how accurate this number is without further analysis into ICD codes and comparable data sets. But the purpose is clear: some costs are not picked up using ICD codes alone (Lewin 2013). We find value in that recognition and therefore included this category.
Specialty Diseases
Treatment costs for AIDs and Hepatitis C that are not attributed to hospitalization were estimated.
| Specialty Diseases | Cost in Thousands | Double Counting Adjustment | % of Total |
| AIDS ART Treatment | 17,858,469 | 15,663,255 | 19% |
| Hepatitis C Treatment | 13,278,633 | 11,646,386 | 14% |
| Subtotal | 3,282,166 | 2,878,713 | 3% |
Table 10: Specialty Diseases
AIDS:
We replicated NDIC’s methodology. The NDIC report states that 18.5% of all AIDs cases can be attributed to intravenous drug use (NDIC 2011). They calculated the cost of Anti-Retroviral Therapy (ART) in 2003 dollars and the number of individuals on ART in the US. We updated those values adjusting the 2007 ART cost to 2016 dollars and identifyied the number of individuals on ART in 2016. The number of individuals multiplied by the cost of treatment multiplied by the attribution fraction gave a total cost of $1.6 billion (Avert 2017). We should note that the costs of ART may or may not have outpaced inflation and therefore the accuracy of the cost could shift the results.
Hepatitis C:
We replicated Alaska Methodology. The Alaskan report “The Economic Cost of Drug Abuse in Alaska, 2016 update” (Alaska) took the number of new cases of Hepatitis C reported and then multiplied it by the cost of a 12 week treatment. This value was then multiplied by the attribution rate of 61.6% (Alaska 2016). We updated these numbers using the CDC hepatitis statistics and found the cost to be $1.67 billion dollars (CDC 2017).
Analysis:
Cases of Hepatitis C are rapidly increasing in the US in parallel with the opioid crisis. The CDC identifies the total number of new cases of Hepatitis C by multiplying the number of reported cases by 13.9 (CDC 2017). As evidenced on the chart below, CDC rates are rapidly increasing. We expect this number to rise as long as the opioid crisis persists.
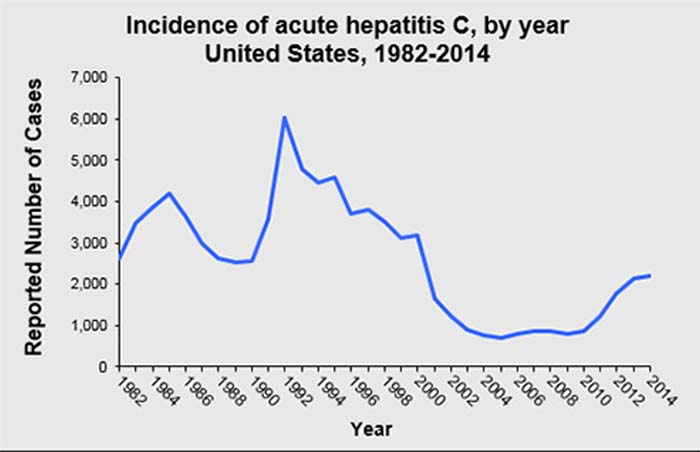
Figure 3: CDC DATA retrieved from: https://www.cdc.gov/hepatitis/statistics/index.htm
Treatment
| Treatment | Cost in Thousands | Double Counting Adjustment | % of Total |
| Community Based SpecialtyTreatment | 17,858,469 | 15,663,255 | 19% |
| Federal -Provided SpecialtyTreatment | 13,278,633 | 11,646,386 | 14% |
| Subtotal | 31,137,102 | 27,309,641 | 32% |
Table 11: Treatment
Methodology and Background
Treatment costs are divided into community specialty treatment and federal specialty treatment. Federal specialty treatment was calculated by summing the line items identified as treatment costs in the Office of National Drug Control Policy’s 2017 budget request (ONDCP 2016). This totaled $11.6 billion, after the 12.29% double counting adjustment. These line items are identified in table 12.
| Federal Treatment (AS IN ONDCP 2017 BUDGET) | |
| Court Services and Offender Supervision Agency for the District of Columbia | $34.56 |
| Department of Defense | $75.50 |
| Defense Health Program | $75.50 |
| Department of Education | $50.10 |
| Office of Elementary and Secondary Education | $50.10 |
| Federal Judiciary | $191.32 |
| Department of Health and Human Services | $11,567.10 |
| Centers for Medicare & Medicaid Services2 | $8,760.00 |
| Health Resources and ServicesAdministration | $116.00 |
| Indian Health Service | $84.63 |
| National Institute of Health | $698.90 |
| Substance Abuse and Mental HealthServices Administration | $1,907.58 |
| Department of Housing and Urban Development | $486.90 |
| Community Planning and Development –Homeless Assistance | $486.90 |
| Department of Justice | $201.61 |
| Bureau of Prisons | $116.61 |
| Office of Justice Programs | $85.00 |
| Office of National Drug Control Policy | $9.12 |
| High Intensity Drug Trafficking Areas | $3.77 |
| Other Federal Drug Control Programs | $2.00 |
| Salaries and Expenses | $3.35 |
| Department of Veterans Affairs | $662.43 |
| TOTAL | 13,278,633 |
Table 12: Treatment (Federal)
For community specialty treatment, we replicated the NDIC methodology. NDIC determined the average number of people in treatment in the US by treatment type on any given day. They multiplied this number by the cost per day of treatment type and 365 days to get a cost per year. NDIC gives an attribution to drugs in treatment. That is, since the value reported is the total number in treatment and some people were in treatment for alcohol and not drugs, the cost had to be discounted to identify the costs only to drugs. Since our study is covering drugs and alcohol, that step was not necessary and could be skipped.
We used the National Survey of Substance Abuse Treatment Services (N-SSATS) to determine the number of facilities by type in the US. This data set provides the median population by facility type. This number had to be adjusted based on opioid treatment programs and non-opioid treatment programs. The average population multiplied by the total number of facilities gave the average number of treatment in any given day. The cost of treatment for residential, methadone, and non-methadone treatment were provided from a 2003 study by SAMSHA “Alcohol and Drug Services Cost Study”. We updated these values by the price of CPI-MS. Multiplying population in treatment-by-treatment provided a total cost. We found the total cost for treatment to be $15.6 Billion, after the 12.29% double counting adjustment.
| Treatment Type | Census* | Cost Per Day** | Cost Per Person | Total Cost |
| detoxification | 71,060 | $332.55 | $121,381.07 | 8,625,338,797 |
| Residential | 102,934 | $119.03 | $43,446.04 | 4,472,075,173 |
| outpatient | 276,027 | $19.78 | $7,219.13 | 1,992,675,157 |
| outpatient (Methadone) | 431,780 | $17.57 | $6,414.47 | 2,769,639,529 |
| Total | 17,859,728,657 |
Table 13: Treatment (Community)
| *Census is from # of treatment centers and median population per type as reported by N-SSATS Census represents the average population per day of the centers |
| ** Costs per day from ADSS study Adjusted for inflation. Detox is calculated from NDIC 2011 paper |
Analysis
Interviews with substance abuse treatment providers revealed that inflation adjusted 2003 cost values may be lower than cost of treatment in 2016. If that is the case, then our values are under estimating the treatment costs.
| Treatment Costs Triangulation (in Thousands) | ||
| Low Estimate | Our Value | High Estimate |
| $23,406,587 | $27,310,352 | $ 31,137,101 |
Table 14: Triangulation
We bracketed the treatment to see how conservative our estimation was. On the low end, we took the NDIC value of $5.6 billion in treatment costs and updated it to 2016 dollars and assumed that drugs made up 33% percent of the total substance abuse cost (Hardwood 1998, Lewin 2013). This assumption is based on SAMHSA substance abuse percentages (SAMHSA 2017). On the high end, since 12.29% of substance abusers abuse both alcohol and drugs, we have been discounting values to avoid double counting. In this case, the federal line items for treatment are explicitly stated. Therefore, we feel confident that the federal government is spending $13 billion on treatment. Since we are considering only those that are receiving treatment, double counting avoidance may not be necessary. If that is true, the value would be $31.1 billion. With this bracket, we feel comfortable with the $27 billion treatment evaluation.
Health Insurance Administration
| Cost in Thousands | Double Counting Adjustment | % of Total | |
| Health Insurance Administration | 4,741,716 | 4,158,851 | 5% |
Table 15: Insurance
Using NDIC methodology, insurance costs are not considered, but insurance administration costs are considered. These costs are considered to be 6% overhead on medical services. We found costs of $4.7 billion for health insurance costs. This number will grow in proportion to the value of to health care expenditure.
Crime Victim Health Care Costs
| Cost in Thousands | Double Counting Adjustment | % of Total | |
| Crime Victim Health Care Costs | 26,338 | 23,101 | 0% |
Table 16: Crime Victims
Methodology and Background
We replicated the NDIC method of crime victim health care costs. They found the number of violent crimes and property crimes occurring in 2007 and multiplied them by an average medical cost per event. NDIC then applied an attribution rate of drugs to both violent and property crimes.
We replicated Figure 1.4 in the NDIC report updating the number of crimes to the most recent statistics provided by the Bureau of Justice Statistics Crime Victimization (BJS 2015). We adjusted the medical costs per event for inflation and then used the weighted average attribution for drugs for state and federal violent and property crimes. It should be noted that this estimate is only for drug offenses and should be significantly lower than drug and alcohol use.
| Violent Crime | Property Crime | |
| # of events | 5,006,620 | 14,611,040 |
| Medical Costs Per Event | 43.27 | 0 |
| Total Medical Costs | 216631174.35 | 0 |
| Attribution | 0.12 | 0.305 |
| Total Medical Costs due to Drugs | $26,338,249 | 0 |
Table 15: Crime Victim Health Costs (NDIC 2011, BJS 2015)
Analysis
While the crime statistics are recent, both the medical costs per incident and the attribution factor are not. The attribution factors used by NDIC come from a 2004 prison survey (NDIC 2011). The medical costs come from the crime victimization survey (BJS 2007). While the survey is completed annually the medical costs are not updated annually. Therefore, this data may be outdated. Additionally, in recent years violent crime has decreased but drug use has increased. This signals to us that the attribution factors may have shifted since 2004. At $26 million, the medical cost to crime victims is by far the smallest economic cost we studied and therefore not a major concern for the accuracy of the entire valuation.
II. Productivity Loss
Summary
| Productivity Loss | Costs in Thousands | Double Counting Adjustment | % of Total |
| Productivity Loss due to Health | 302,097,741 | 264,963,035 | 78% |
| Premature death (Mortality) | 103,089,208 | 90,417,192 | 27% |
| Morbidity – Diminishedproductivity | 180,419,200 | 158,241,563 | 47% |
| Morbidity – Absenteeism | 18,589,333 | 16,304,280 | 5% |
| Productivity Loss due to Crime | 83,755,551 | 73,460,082 | 22% |
| Subtotal | 385,853,292 | 338,423,117 | 59% |
Table 16: Productivity Summary.
Productivity loss is by far the largest contributor to drug and alcohol economic costs. The loss is primary attributed to premature death and diminished productivity. The magnitude of these assumptions indicates that our assumptions on valuing human life and assumptions on earnings have a large impact on overall value.
Productivity Loss due to Poor Health from Substance Abuse
Premature Death (Mortality):
2015 was a terrible year for drug and alcohol deaths. With a 10% increase from 2014, there was nearly 95,000 deaths (CDC Wonder 2017).
| 2013 | 2014 | 2015 | |
| Drugs | |||
| UCD | 46,471 | 49,714 | 55,403 |
| MCD | 50,069 | 53,578 | 59,707 |
| Average | 48,270 | 51,646 | 57,555 |
| 5.30% | 6.08% | 10.55% | |
| Alcohol | |||
| UCD | 29,001 | 30,722 | 33,171 |
| MCD | 35,892 | 38,194 | 41,420 |
| Average | 32,447 | 34,458 | 37,296 |
| 4.2% | 5.3% | 7.4% | |
| Total | 80,717 | 86,104 | 94,851 |
| Growth | 4.8% | 5.8% | 9.3% |
Table 17: Deaths due to Drugs and Alcohol
| Salary Bucket | Premature death (Mortality) year* | Discounted Value of Future Earnings** | Value Used (averaging Buckets) | Loss to Society (using Total Value) | |||||||
| Drugs | Alc. | Total | Market Productivity 3% | Total Productivity 3% | Market Productivity 3% | Total Productivity 3% | Drugs | Alcohol | Total | ||
| 0–4 | <1 year< td> | 29 | 1 | 30 | 965,701 | 1,389,094 | 965,701 | 1,389,094 | 40,283,729 | 1,389,094 | 41,672,823 |
| 1-4 years | 56 | – | 56 | 965,701 | 1,389,094 | 965,701 | 1,389,094 | 77,789,270 | – | 77,789,270 | |
| 5–9 | 5-14 years | 60 | 4 | 64 | 1,067,698 | 1,535,808 | 1,123,086 | 1,615,480 | 96,928,817 | 6,461,921 | 103,390,738 |
| 10–14 | 1,178,474 | 1,695,152 | – | – | – | ||||||
| 15–19 | 15-24 years | 4,406 | 353 | 4,759 | 1,288,777 | 1,845,311 | 1,323,873 | 1,887,911 | 8,318,135,589 | 666,432,561 | 8,984,568,149 |
| 20–24 | 1,358,969 | 1,930,511 | – | – | – | ||||||
| 25–29 | 25-34 years | 1,433 | 2,204 | 14,636 | 1,345,117 | 1,910,743 | 1,299,603 | 1,850,168 | 3,002,210,586 | 4,076,844,643 | 27,079,055,230 |
| 30–34 | 1,254,090 | 1,789,593 | – | – | – | ||||||
| 35–39 | 35-44 years | 12174 | 4,510 | 16,684 | 1,121,587 | 1,612,649 | 1,038,080 | 1,505,831 | 8,331,235,124 | 6,791,298,345 | 25,122,533,469 |
| 40–44 | 954,574 | 1,399,014 | – | – | – | ||||||
| 45–49 | 45-54 years | 14318 | 10,583 | 24,900 | 765,022 | 1,166,248 | 661,446 | 1,043,998 | 4,947,434,540 | 1,048,103,790 | 25,995,538,330 |
| 50–54 | 557,870 | 921,747 | – | – | – | ||||||
| 55–59 | 55-64 years | 1,340 | 12,306 | 22,645 | 352,577 | 680,541 | 267,830 | 575,210 | 5,947,379,770 | 7,078,241,864 | 13,025,621,634 |
| 60–64 | 183,083 | 469,878 | – | – | – | ||||||
| 65–69 | 65-74 years | 2,650 | 5,383 | 8,033 | 78,226 | 319,142 | 59,350 | 275,502 | 729,941,644 | 1,483,025,427 | 2,212,967,071 |
| 70–74 | 40,473 | 231,861 | – | – | – | ||||||
| 75–79 | 75-84 years | 714 | 1,576 | 2,289 | 19,952 | 165,643 | 14,528 | 142,539 | 101,701,222 | 224,569,411 | 326,270,633 |
| 80 and over | 85+ years | 372 | 371 | 743 | 9,104 | 119,435 | 14,528 | 142,539 | 53,024,323 | 52,810,515 | 105,834,838 |
| Not Stated | 6 | 7 | 13 | 703,066 | 1,074,306 | 6,445,835 | 7,520,141 | 13,965,976 | |||
| Total | 57,555 | 37,296 | 94,851 | 71,652,510,449 | 31,436,697,713 | 103,089,208,162 |
Table 18: Death by Age and Future Earnings
| * CDC Wonder data to get year of death |
| ** ATUS (American Time Use Survey) adjusted data to determine discounted value of future earnings |
| *** The breakdown of years of death and the ATUS didn’t match, used “buckets” of salary |
Methodology and Background
We replicated NDIC’s methodology. We determined the number of deaths a year attributed to drugs and alcohol by age at death. We then used a 3% discounted value of all lifetime earnings per age group to determine the economic value lost to early death. We used the CDC Wonder Data and requested Underlying Cause of Death (UDC) and Multiple Cause of Death (MCD) data on deaths attributable to drugs and alcohol in 2015, the most recent year available (CDC Wonder 2017). We recognize that many UCD deaths could be double counted in the MCD data and that some deaths with MCD attributable to drugs and alcohol may not have been registered as an alcohol or drug UCD. Therefore, we felt comfortable averaging the two numbers to determine the number of deaths per year to drugs and alcohol.
We used Grosse’s “2009 Economic Productivity by Age and Sex: 2007 Estimates for the United States” to determine the discounted value of future earnings. This study uses the American Time Use Survey to determine the market and total production by age group (Grosse 2009, BLS 2017). We inflated their findings to 2016 dollars.
Analysis
This value could be over-inflated as there is no way of knowing how long someone would have lived had they not engaged in drugs or alcohol abuse. There is also an assumption about the type of person who uses drugs or alcohol that may impact their economic productivity. While we are using the ATUS data on the average person, a substance abuser may represent the average. This predicament highlights an important debate in COI studies. The balance between what would someone’s earning power be if they stopped being dependent on substances today versus what would their earning power be if these substances never existed over the course of their entire life (Collins 2006, Moore 2005).
Our analysis sides with the latter argument, that if substance abuse was not a problem in society, substance abusers could be as productive as the average person.
| Premature Death Triangulation (in Thousands) | ||
| Our Estimate (low) | Middle Value | High Estimate |
| 90,417,192 | 97,200,448 | 108,500,630 |
Table 19: Triangulation
The inflation adjusted values for the Lewin’s 2006 report on alcohol and the 2007 report on drugs totaled health care costs to $97 billion. Recent studies have stated that the ICD codes on autopsy reports may not be accounting for all drug related deaths. This would indicate that the CDC Wonder data is undervalued. According to Ruhm’s Study 2017 study “Geographic Variation in Opioid and Heroin Involved Drug Poisoning Mortality Rates”, the value may be underestimated by as much as 20%. Therefore, we believe our value is actually the low estimation.
Morbidity – Diminished productivity
| Age Category | Number of substance abusers (SAMSHA) Millions | Productivity (ATUS values) | Loss (# x ATUS) | ||||||
| Drugs | Alcohol | Drugs / Alcohol | Salary Buckets | Salary in Age Group | Decrease in Productivity | Drugs | Alcohol | Total | |
| TOTAL | 7,737 | 15,736 | 20,810 | ||||||
| 12 | 23 | 2 | 25 | 15–19 | – | – | – | – | – |
| 13 | 36 | 23 | 44 | 15–19 | – | – | – | – | – |
| 14 | 86 | 52 | 110 | 15–19 | – | – | – | – | – |
| 15 | 183 | 111 | 244 | 15–19 | 13,656 | 2,390 | 437,324,024 | 265,262,113 | 583,098,699 |
| 16 | 278 | 187 | 396 | 15–19 | 13,656 | 2,390 | 664,350,157 | 446,883,019 | 946,340,512 |
| 17 | 248 | 248 | 414 | 15–19 | 13,656 | 2,390 | 592,657,694 | 592,657,694 | 989,355,989 |
| 18 | 284 | 296 | 489 | 15–19 | 13,656 | 2,390 | 678,688,650 | 707,365,635 | 1,168,587,147 |
| 19 | 332 | 433 | 634 | 15–19 | 13,656 | 2,390 | 793,396,591 | 1,034,761,216 | 1,515,100,718 |
| 20 | 336 | 416 | 637 | 20–24 | 34,126 | 5,972 | 2,006,628,066 | 2,484,396,653 | 3,804,232,374 |
| 21 | 385 | 525 | 731 | 20–24 | 34,126 | 5,972 | 2,299,261,325 | 3,135,356,352 | 4,365,610,464 |
| 22 | 295 | 570 | 733 | 20–24 | 34,126 | 5,972 | 1,761,771,665 | 3,404,101,183 | 4,377,554,679 |
| 23 | 305 | 570 | 760 | 20–24 | 34,126 | 5,972 | 1,821,492,738 | 3,404,101,183 | 4,538,801,577 |
| 24 | 297 | 512 | 682 | 20–24 | 34,126 | 5,972 | 1,773,715,879 | 3,057,718,957 | 4,072,977,204 |
| 25 | 296 | 499 | 662 | 25–29 | 58,978 | 10,321 | 3,055,054,165 | 5,150,243,339 | 6,832,587,355 |
| 26-29 | 833 | 1,776 | 2,338 | 25–29 | 58,978 | 10,321 | 8,597,500,403 | 18,330,324,989 | 24,130,799,450 |
| 30-34 | 840 | 1,807 | 2,398 | 30–34 | 69,094 | 12,091 | 10,156,786,357 | 21,849,182,080 | 28,995,206,767 |
| 35-39 | 585 | 1,564 | 1,911 | 35–39 | 75,219 | 13,163 | 7,700,578,364 | 20,587,529,165 | 25,155,222,656 |
| 40-44 | 463 | 1,228 | 1,566 | 40–44 | 76,326 | 13,357 | 6,184,340,209 | 16,402,526,517 | 20,917,228,441 |
| 45-49 | 518 | 1,145 | 1,497 | 45–49 | 75,197 | 13,159 | 6,816,605,601 | 15,067,593,462 | 19,699,726,998 |
| 50-54 | 446 | 1,465 | 1,743 | 50–54 | 72,765 | 12,734 | 5,679,335,116 | 18,655,215,122 | 22,195,249,117 |
| 55-59 | 369 | 966 | 1,229 | 55–59 | 63,528 | 11,117 | 4,102,334,387 | 10,739,444,493 | 13,663,330,519 |
| 60-64 | 160 | 675 | 790 | 60–64 | 51,250 | 8,969 | 1,435,002,137 | 6,053,915,265 | 7,085,323,051 |
| 65 or Older | 139 | 666 | 777 | 65–69 | 29,213 | 5,112 | 710,599,413 | 3,404,742,511 | 3,972,199,597 |
| Total | 67,267,422,941 | 154,773,320,946 | 199,008,533,314 |
Table 20: Diminished Productivity
Methodology and Background
The NDIC states that the “The reduction in productivity attributable to illicit drug use is assumed to vary by sex…expressed as a proportion, this number is 0.17 for males and 0.18 for females” (NDIC 2011). We use an average reduction of 17.5% for the population. We use SAMHSA data on the number of drug users by age and then used Grosse’s 2009 estimates of market productivity to determine the total loss in productivity by substance abusers. We then subtracted the value of productivity loss due to absenteeism (calculated below). We found the economic cost due to diminished productivity to be $158 billion.
Analysis
We recognize that using 17.5% rather than 17% for males and 18% for females is not exact, as the portion of male and female substance abusers is not 50/50. Given that this number only considers drug attribution and our study is considering drug and alcohol, we find this assumption to have a minimal affect in accuracy.
The productivity loss to diminished productivity is the largest single category, totaling nearly 30% of the entire economic cost.
| Diminished Productivity Triangulation (in Thousands) | ||
| Low Estimate | Our Value | High Estimate |
| 157,726,477 | 158,241,563 | 180,419,200 |
Table 21: Triangulation
The inflation adjusted values for the Lewin’s 2006 report on Alcohol and NDIC’s 2011 report on drugs yields health care costs of $57 billion, nearly the same as our estimation. Since 12.29% of substance abusers abuse both alcohol and drugs, we have been discounting values to avoid double counting. In this case, if being a drug and alcohol drug user, rather than one or the other, compounded productivity loss would not be necessary. If that is true, the value would be $180 Billion.
We must recognize that using one value to diminish productivity for all drugs and alcohol is suspect. Drugs and drug abuse manifest themselves in different ways. Regardless, the economic impact of drug addiction is a large component of total costs.
Morbidity – Absenteeism
Treatment
Following NDIC methodology, we used the Treatment Episode Data Set- Discharge (TEDS-D) to determine the average length of treatment and the Treatment Episode Data Set- Admission (TEDS-A) to get an average admittance per day. TEDS-A breaks the data down by age, which we use with Grosse’s productivity data to determine the amount of economic activity lost in treatment. (Grosse 2009, TEDS-A 2017, TEDS-D 2017, SAMHSA 2017).
TREATMENT
| Male | Treatment Population | ATUS Data | Economic Loss due to Productivity Loss due to Treatment | |||||||
| AGE AT ADMISSION | % of Pop | TEDS-A Admitted Per Day | Length of Stay | In Care (Admits*Length of Stay) | MPV | HPV | TPV | MPV | HPV | TPV |
| 12-17 | 2.82 | 126.88 | 65.34 | 8,290 | 7,333 | 5,395 | 12,728 | 60,786,674 | 44,724,481 | 105,511,155 |
| 18-20 | 2.75 | 123.93 | 65.34 | 8,097 | 7,333 | 5,395 | 12,728 | 59,373,031 | 43,684,377 | 103,057,407 |
| 21-25 | 9.56 | 430.81 | 65.34 | 28,147 | 27,354 | 7,201 | 34,555 | 769,938,384 | 202,683,332 | 972,621,716 |
| 26-30 | 11.53 | 519.34 | 65.34 | 33,931 | 53,246 | 10,498 | 63,745 | 1,806,713,165 | 356,217,319 | 2,162,930,484 |
| 31-35 | 9.89 | 445.57 | 65.34 | 29,111 | 66,445 | 13,023 | 79,467 | 1,934,292,401 | 379,111,858 | 2,313,404,259 |
| 36-40 | 6.94 | 312.78 | 65.34 | 20,436 | 73,615 | 13,825 | 87,439 | 1,504,376,238 | 282,527,319 | 1,786,879,516 |
| 41-45 | 6.03 | 271.47 | 65.34 | 17,737 | 75,475 | 13,506 | 88,980 | 1,338,673,531 | 239,557,816 | 1,578,210,482 |
| 46-50 | 6.03 | 271.47 | 65.34 | 17,737 | 75,565 | 13,476 | 89,041 | 1,340,280,181 | 239,015,311 | 1,579,295,492 |
| 51-55 | 5.31 | 239.01 | 65.34 | 15,616 | 74,299 | 12,038 | 86,339 | 1,160,262,321 | 187,988,289 | 1,348,268,980 |
| 56-60 | 3.01 | 135.74 | 65.34 | 8,868 | 60,944 | 13,326 | 74,270 | 540,470,894 | 118,182,691 | 658,653,584 |
| 61-65 | 1.18 | 53.11 | 65.34 | 3,470 | 46,102 | 13,926 | 60,027 | 159,985,082 | 48,327,423 | 208,308,423 |
| 66 + | 0.52 | 23.61 | 65.34 | 1,542 | 10,247 | 14,281 | 24,528 | 15,804,322 | 22,025,896 | 37,830,672 |
| TOTAL | 10,690,956,223 | 2,164,046,112 | 12,854,972,171 | |||||||
| Female | ||||||||||
| 12-17 | 1.48 | 66.64 | 65.34 | 4,354 | 5,881 | 8,835 | 14,716 | 25,604,219 | 38,465,230 | 64,069,449 |
| 18-20 | 1.44 | 65.09 | 65.34 | 4,253 | 5,881 | 8,835 | 14,716 | 25,008,772 | 37,570,690 | 62,579,462 |
| 21-25 | 5.02 | 226.26 | 65.34 | 14,783 | 19,664 | 14,952 | 34,616 | 290,682,697 | 221,033,627 | 511,716,323 |
| 26-30 | 6.05 | 272.75 | 65.34 | 17,820 | 33,097 | 21,991 | 55,088 | 589,799,085 | 391,878,663 | 981,677,748 |
| 31-35 | 5.19 | 234.01 | 65.34 | 15,289 | 34,843 | 26,199 | 61,042 | 532,712,171 | 400,550,343 | 933,280,500 |
| 36-40 | 3.65 | 164.27 | 65.34 | 10,733 | 39,367 | 25,996 | 65,363 | 422,516,487 | 279,009,363 | 701,525,851 |
| 41-45 | 3.16 | 142.57 | 65.34 | 9,315 | 42,198 | 24,162 | 66,360 | 393,078,371 | 225,074,900 | 618,153,271 |
| 46-50 | 3.16 | 142.57 | 65.34 | 9,315 | 43,478 | 21,021 | 64,498 | 405,001,127 | 195,815,930 | 600,806,099 |
| 51-55 | 2.79 | 125.53 | 65.34 | 8,201 | 43,314 | 19,235 | 62,549 | 355,235,984 | 157,757,233 | 512,993,217 |
| 56-60 | 1.58 | 71.29 | 65.34 | 4,658 | 35,837 | 20,019 | 55,856 | 166,913,109 | 93,239,680 | 260,152,789 |
| 61-65 | 0.62 | 27.90 | 65.34 | 1,823 | 25,055 | 20,801 | 45,856 | 45,663,718 | 37,910,877 | 83,574,596 |
| 66 + | 0.28 | 12.40 | 65.34 | 810 | 3,342 | 19,214 | 22,556 | 2,707,205 | 15,563,333 | 18,270,299 |
| Total | 3,254,922,946 | 2,093,869,869 | 5,348,799,605 | |||||||
| TOTAL | 13,945,879,169 | 4,257,915,982 | 18,203,771,775 |
Table 22: Productivity Loss do to Treatment
Hospitalization
We replicated NDIC numbers for hospitalizations due to hepatitis, HIV, and tuberculosis. We adjusted Hepatitis C for the growth rate in new cases according to the CDC (CDC 2017). All other values were adjusted for the cost of inflation in medical services (BLS 2017).
| Hospitalization | NDIC Report: 2007 $ | Inflation Adjustment | 2016 Dollars | |
| Full Attribution | 229030 | 1.3288 | 304339.9943 | |
| Hepatitis B (Partial Attribution) | 497 | 1.3288 | 660.4242988 | |
| Hepatitis C (Partial Attribution) | 4,226.77 | 1.3288 | 5616.622237 | |
| HIV (Partial Attribution) | 16034 | 1.3288 | 21306.32436 | |
| Tuberculosis (Partial Attribution) | 1,357 | 1.3288 | 1803.210812 | |
| Non Drug Induced Primary Diagnosis (Partial) | 39,008 | 1.3288 | 51834.67011 | |
| Subtotal | 385,853,292 | |||
Table 23: Hospitalization
We chose to inflate all values outside of Hepatitis C from the NDIC report because hospitalization for complications related to substance abuse is a small number relative to the total costs (less than .005% percent of total costs). Hepatitis C was adjusted to account for the growth in Hepatitis C, as done previously.
Analysis
We found the total productivity lost to drug treatment and hospitalization to be $16 billion in 2016. TEDS does not consider all substance abuse facilities. Mainly, it considers sources from publically funded treatment facilities. Considering this fact, the value of absenteeism for treatment may be undervalued.
| Productivity Lost for Treatment And Hospitalization Triangulation(in Thousands) | ||
| Low Estimate | Our Value | High Estimate |
| $6,414,347 | $16,304,280 | $18,589,333 |
Table 24: Triangulation
The inflation adjusted values for the Lewin’s 2006 report on alcohol and NDIC’s 2011 report on drugs yields productivity loss to absenteeism as $6.4 billion. This is substantially lower than our value. One explanation is that Lewin’s productivity methodology does not consider household productivity. Lewin uses average salary. While the NDIC uses the same ATUS data as our report, the treatment for drug abuse is only a fraction of the total treatment for drug and alcohol in the US. These two facts contribute to a lower productivity factor for productivity loss for treatment and hospitalization. Since 12.29% of substance abusers abuse both alcohol and drugs, we have been discounting values to avoid double counting. Since we are considering only those that are receiving treatment, double counting avoidance may not be necessary. If that is true, the value would be $18.5 billion.
Productivity Loss due to Crime
Incarceration
We replicated the NDIC method for productivity lost due to incarceration. NDIC uses 2004 values for jail and prison populations. While we found new values for jail and prison populations as a whole, we did not find age and sex demographics for these populations. Therefore, we adjusted NDIC’s values using a proxy as the total percentage change in prison populations since 2004. This relies on the assumption that the age brackets will maintain the same percentages even though the overall prison population has changed.
We determined the percentage change in prison and jail populations from 2005 to 2015 and apply it to NDIC’s age/sex break down (BJS 2017, NDIC 2011). We adjusted the attribution rate that NDIC uses for drugs to include drugs and alcohol by adding the attribution rate for alcohol for state and federal corrections, as stated in Lewin 2013. We found the economic value lost to incarceration to be $73 billion.
| Prison Population Adjustment from 2011 – 2016 | |||
| Location | Jails | State Prisons | Federal |
| Population in 2004 | 780,581 | 1,321,731 | 196,804 |
| Percentage Change since 2005 (From the Two Tables Above) | -2.6% | -0.59% | 4.71% |
| Adjusted Population in 2015 | 760,426.87 | 1,313,874.44 | 206,073.67 |
Table 25: Adjustment from 2011-2016
| Prison Population 2016 | ||||||
| Location | Jail | State | Federal | |||
| Total population | 760,426.87 | 1,313,874.44 | 206,073.67 | |||
| Attribution | 0.50 | 0.552 | 0.649 | |||
| Population due to Drugs and Alcohol | 379,453.01 | 725,258.69 | 133,741.81 |
Table 26: Population Values for Study
Same Demographics as 2011 Study
| MALE | Jails | State Prison | Federal Prison | TOTAL | MPV | HPV | TPV | Economic Loss MPV | Economic Loss HPV | Economic Loss TPV | |||
| 15–19 | 0.07 | 26,561.71 | 2% | 14,505 | 0 | – | 41,067 | $7,333 | $5,395 | $12,728 | $301,124,214.47 | $221,555,534.66 | $522,679,749.13 |
| 20–24 | 0.21 | 79,685.13 | 15% | 108,789 | 0.11 | 14,711.60 | 203,186 | $27,354 | $7,201 | $34,555 | $5,557,889,374.48 | $1,463,093,104.30 | $7,020,982,478.78 |
| 25–29 | 0.15 | 56,917.95 | 17% | 123,294 | 0.19 | 25,410.94 | 205,623 | $53,246 | $10,498 | $63,745 | $10,948,684,999.64 | $2,158,677,586.87 | $13,107,362,586.51 |
| 30–34 | 0.14 | 3,123.42 | 16% | 116,041 | 0.2 | 26,748.36 | 195,913 | $66,445 | $13,023 | $79,467 | $13,017,357,019.49 | $2,551,338,365.22 | $15,568,695,384.70 |
| 35–39 | 0.14 | 53,123.42 | 15% | 108,789 | 0.14 | 18,723.85 | 180,636 | $73,615 | $13,825 | $87,439 | $13,297,472,255.15 | $2,497,313,569.78 | $15,794,573,323.78 |
| 40–44 | 0.08 | 30,356.24 | 14% | 101,536 | 0.12 | 16,049.02 | 147,941 | $75,475 | $13,506 | $88,980 | $11,165,824,304.31 | $1,998,142,507.25 | $13,163,792,772.49 |
| 45–49 | 0.05 | 18,972.65 | 8% | 58,021 | 0.1 | 13,374.18 | 90,368 | $75,565 | $13,476 | $89,041 | $6,828,639,129.47 | $1,217,767,245.20 | $8,046,406,374.67 |
| 50–54 | 0.01 | 3,794.53 | 3% | 21,758 | 0.05 | 6,687.09 | 32,239 | $74,299 | $12,038 | $86,339 | $2,395,365,924.60 | $388,102,528.68 | $2,783,506,379.84 |
| 55–59 | 0 | – | 1% | 7,253 | 0.01 | 1,337.42 | 8,590 | $60,944 | $13,326 | $74,270 | $523,506,278.20 | $114,473,103.36 | $637,979,381.56 |
| 60–64 | 0 | – | 0% | 0 | 0.01 | 1,337.42 | 1,337 | $46,102 | $13,926 | $60,027 | $61,657,822.34 | $18,625,259.66 | $80,281,508.66 |
| 65–69 | 0 | – | 0% | 0 | 0 | – | 0 | $18,555 | $15,180 | $33,737 | $0.00 | $0.00 | $0.00 |
| 70–74 | 0 | – | 0% | 0 | 0 | – | 0 | $11,466 | $15,620 | $27,087 | $0.00 | $0.00 | $0.00 |
| 75–79 | 0 | – | 0% | 0 | 0 | – | 0 | $6,438 | $14,794 | $21,233 | $0.00 | $0.00 | $0.00 |
| 80 | – | 0% | 0 | 0 | – | 0 | $4,528 | $11,529 | $16,057 | $0.00 | $0.00 | $0.00 | |
| All Male | 0.86 | 326,329.59 | 92% | 667,238 | 0.93 | 124,379.89 | 1,117,947 | $64,097,521,322 | $12,629,088,805 | $76,726,259,940 | |||
| FEMA.LE | |||||||||||||
| 15–19 | 0% | – | 0 | 0 | 0 | – | 0 | $5,881 | $8,835 | $14,716 | $0 | $0 | $0 |
| 20–24 | 2% | 7,589.06 | 0.01 | 7,253 | 0.01 | 1,337.42 | 16,179 | $19,664 | $14,952 | $34,616 | $318,138,774 | $241,911,087 | $560,049,862 |
| 25–29 | 2% | 7,589.06 | 0.01 | 7,253 | 0.01 | 1,337.42 | 16,179 | $33,097 | $21,991 | $55,088 | $535,478,090 | $355,786,306 | $891,264,397 |
| 30–34 | 3% | 11,383.59 | 0.01 | 7,253 | 0.01 | 1,337.42 | 19,974 | $34,843 | $26,199 | $61,042 | $695,935,150 | $523,278,945 | $1,219,237,591 |
| 35–39 | 3% | 11,383.59 | 0.02 | 14,505 | 0.01 | 1,337.42 | 27,226 | $39,367 | $25,996 | $65,363 | $1,071,818,862 | $707,777,110 | $1,779,595,973 |
| 40–44 | 3% | 11,383.59 | 0.01 | 7,253 | 0.01 | 1,337.42 | 19,974 | $42,198 | $24,162 | $66,360 | $842,838,605 | $482,605,579 | $1,325,444,184 |
| 45–49 | 1% | 3,794.53 | 0.01 | 7,253 | 0.01 | 1,337.42 | 12,385 | $43,478 | $21,021 | $64,498 | $538,449,487 | $260,337,515 | $798,772,433 |
| 50–54 | 0% | – | 0 | 0 | 0.01 | 1,337.42 | 1,337 | $43,314 | $19,235 | $62,549 | $57,928,994 | $25,725,766 | $83,654,761 |
| 55–59 | 0% | – | 0 | 0 | 0 | – | 0 | $35,837 | $20,019 | $55,856 | $0 | $0 | $0 |
| 60–64 | 0% | – | 0 | 0 | 0 | – | 0 | $25,055 | $20,801 | $45,856 | $0 | $0 | $0 |
| 65–69 | 0% | – | 0 | 0 | 0 | – | 0 | $7,680 | $21,655 | $29,335 | $0 | $0 | $0 |
| 70–74 | 0% | – | 0 | 0 | 0 | – | 0 | $3,434 | $20,646 | $24,080 | $0 | $0 | $0 |
| 75–79 | 0% | – | 0 | 0 | 0 | – | 0 | $1,495 | $19,422 | $20,918 | $0 | $0 | $0 |
| 80 | 0% | – | 0 | 0 | 0 | – | 0 | $760 | $15,131 | $15,890 | $0 | $0 | $0 |
| All Female | 14% | 53,123.42 | 0.08 | 58,021 | 0.07 | 9,361.93 | 120,506 | $4,060,587,963 | $2,597,422,309 | $6,658,019,200 | |||
| Total | $68,158,109,286 | $15,226,511,114 | $83,384,279,140 |
Table 27: Incarceration
Victims of Crime
We adjusted the 2011 NDIC report based on the percentage decrease in the violent crime and property crime. We then inflated that value to 2016 dollars and then applied an attribution rate for drugs. We found the total loss to crime victimization to be $321 million.
| Adjust for Number of Events | ||
| Violent | Property | |
| 2007 # of Crimes | 5385240 | 17955838 |
| 2015 # of Crimes | 5,006,620 | 14,611,040 |
| % Decrease | -7.0% | -18.6% |
| Table 28: Rates of Change in Violent and Non Violent Crime | ||
| We expect the same ratio and break down of events even if total values change, therefore the percentage decrease for productivity loss was applied. | ||
| Productivity Loss Due to Crime | ||
| Violent Crime | Property Crime | |
| Total Productivity Lost (thousands) | Total Productivity Lost (Thousands) | |
| 2007 Lost Productivity | 834,140.00 | 576,746.00 |
| 2007 Adjusted (adjusted by 7% and 18.6% still in 2007 dollars) | 892,785.87 | 684,181.75 |
| Inflation Adjusted (2016 Dollars) | 1,044,559.47 | 800,492.64 |
| Attribution Rate | 0.122 | 0.305 |
| Productivity Value lost due to Crime in 2016 | 126,998.65 | 244,273.07 |
| Total Productivity Value Lost | 371,271.72 |
Table 29: Productivity Lost to Crime Victims
Analysis:
Incarceration makes up 99% of the costs associated with productivity loss due to crime. This is intuitive as those that are incarcerated lose the entirety of their productivity, whereas crime victims only lose the amount of days they are out of work for hospitalization. As previously noted, the attribution values for crime should be treated with suspicion. The values are outdated. They have not been updated since 2004. Additionally, non-violent drug offenders have experienced a great deal of change in the criminal justice system over the last few years. We made an assumption that the reduction crime would result in a proportionally equal reduction in medical events. If that is proven not to be the case, our results would be skewed. Therefore, we believe that this value may be over inflated.
Crime, Law Enforcement, & Criminal Justice
Summary
| Crime, Law Enforcement and Criminal Justice | Costs in Thousands | Double Counting Adjustment | % of Total |
| Law enforcement | 42,603,356 | 37,366,431 | 44% |
| Judicial | 9,401,002 | 8,245,405 | 10% |
| Correctional | 43,387,678 | 38,054,342 | 45% |
| Private Costs | 1,010,289 | 886,101 | 1% |
| Cost Due To Crime Victims | 1,008,987 | 884,960 | 1% |
| Subtotal | 96,402,325 | 84,552,279 | 15% |
Table 30: Costs Across the Criminal Justice System
Criminal Justice Costs
| Police | Adjudication | Corrections | Total | |||||||||||
| Prop. Att. to Drugs | Police Protection Costs | . Prop. Att. to Drugs +alc | Adjudication costs | Prop. Att. to Drugs +alc | Jail Costs | Prop. Att. to Drugs | Prison Costs | Prop. Att. to Drugs | Probation Costs | Prop. Att. to Drugs | Probation Costs | Drug and Alcohol induced Crime Costs | ||
| State and Local | Arrests | 0.24 | 109,322,359 | 26,237,366.13 | ||||||||||
| Adjudication | 0.24 | 0.54 | 7,368,753 | 6,138,990.35 | ||||||||||
| Jail | 0.499 | 22,243,686 | 11,099,599.33 | |||||||||||
| Prison | 0.552 | 43,847,978 | 24,204,083.58 | |||||||||||
| Parole | 0.49 | 2,266,753 | 1,110,708.76 | |||||||||||
| Probation | 0.39 | 6,079,279 | 2,370,918.84 | |||||||||||
| Federal | Arrests | 0.27 | 35,385,911 | 9,554,195.98 | ||||||||||
| Adjudication | 0.27 | 0.23 | 17,158,871 | 1,043,195.37 | ||||||||||
| Jail | – | |||||||||||||
| Prison | 0.649 | 6,713,584 | 4,357,116.04 | |||||||||||
| Parole | 0.45 | 452,654 | 203,694.21 | |||||||||||
| Probation | 0.35 | 118,735 | 41,557.39 | |||||||||||
| Total | 86,361,426 |
Table 31: Costs Across the Criminal Justice System. Values updated from JEES
| Civil Filings 2016 | Criminal Filings | Total Filings | % that are criminal |
| 274552 | 79787 | 354339 | 0.23 |
Table 32: % of Criminal Cases (Federal)
| # of Arrests | Cost Per Arrest (2006) | Inflation Adjusted Value | Cost Per Arrest (2016) | Total Cost) | ||
| Police Protection | Driving Under the Influence | 1,089,171 | $119.91 | 1.205814948 | $144.59 | $157,482,440.29 |
| Public Drunkenness | 405,880 | $119.91 | 1.205814948 | $144.59 | $58,685,893.09 | |
| Liquor Laws | 469,186 | $119.91 | 1.205814948 | $144.59 | $67,839,261.45 | |
| Total | $284,007.59 | |||||
| Adjudication | Driving Under the Influence | 1,089,171 | $936.80 | 1.205814948 | $1,129.61 | $1,230,335,668.95 |
| Public Drunkenness | 405,880 | $936.80 | 1.205814948 | $1,129.61 | $458,485,069.21 | |
| Liquor Laws | 469,186 | $936.80 | 1.205814948 | $1,129.61 | $529,995,998.03 | |
| $2,218,816.74 |
Table 33: State Alcohol Adjudication and Arrests
| Crime, Law Enforcement and Criminal Justice (Detailed) | Costs in Thousands | Double Counting Adjustment | % of Total |
| Law enforcement | 42,603,356 | 37,366,431 | 44% |
| Police Protection | 36,075,570 | 31,641,059 | 37% |
| State | 26,521,374 | 23,261,292 | 28% |
| Federal | 9,554,196 | 8,379,767 | 10% |
| Drug Control | 6,527,786 | 5,725,372 | 7% |
| Supply Reduction (federal) | 6,527,786 | 5,725,372 | 7% |
| Department of Agriculture | 12,300 | 10,788 | 0% |
| Department of Defense | 1,409,348 | 1,236,107 | 1% |
| Department of Homeland Security | 4,211,700 | 3,693,986 | 4% |
| Department of the Interior | 17,100 | 14,998 | 0% |
| Office of National Drug Control Policy | 261,448 | 229,310 | 0% |
| Department of State | 541,563 | 474,993 | 1% |
| Department of Transportation | 14,070 | 12,340 | 0% |
| Department of the Treasury | 60,257 | 52,850 | 0% |
| Supply Reduction (State) | – | – | 0% |
| Judicial | 9,401,002 | 8,245,405 | 10% |
| State | 8,357,807 | 7,330,442 | 9% |
| Federal | 1,043,195 | 914,963 | 1% |
| Correctional | 43,387,678 | 38,054,342 | 45% |
| Jail | 11,099,599 | 9,735,205 | 12% |
| State | 11,099,599 | 9,735,205 | 12% |
| Federal | – | – | 0% |
| Prison | 28,561,200 | 25,050,376 | 30% |
| State | 24,204,084 | 21,228,849 | 25% |
| Federal | 4,357,116 | 3,821,527 | 5% |
| Parole | 1,314,403 | 1,152,833 | 1% |
| State | 1,110,709 | 974,177 | 1% |
| Federal | 203,694 | 178,656 | 0% |
| Probation | 2,412,476 | 2,115,928 | 3% |
| State | 2,370,919 | 2,079,479 | 2% |
| Federal | 41,557 | 36,449 | 0% |
| Subtotal | 94,383,049 | 82,781,218 |
Table 34: Breakdown of Crime Costs
Background and Methodology
We replicated Figure 1.3 in Department of Justice Summary of the National Drug Intelligence Centers Report (Table 31). NDIC’s attribution values came from a 2004 survey. This survey has not been updated and therefore we use the same attribution numbers. We updated the percentage of cases that were civil versus criminal (Table 32) and we added in the attribution rates for alcohol as reported in Lewin 2013.
We used the Justice Expenditure and Employment Extracts (JEE) to update the Police, Adjudication, and Corrections cost (BJS 2017). The JEE report does not break corrections down into jail, prison, parole, and probation. Therefore, we used proxies of two scenarios and averaged them: if spending was in line with inflation and if spending followed the compound annual growth rate for the values in JEE. We compared these values to the numbers submitted by the ONDCP budget report on federal corrections and prosecutions. These numbers were in line with our expectations.
Analysis
The most important thing to recognize is that the attribution rates are nearly two decades old. Criminal justice in the field of drugs has had large changes over these years that may impact the attribution rates. From decriminalization in major metropolitan areas to the legalization in 4 states, it is self-evident that marijuana crimes must have decreased in proportion to arrests, jails, and prisons nationwide. Another consideration is the concept of avoidable costs – that is, not all costs are avoidable and this is especially true in crime. For example, if a police force is worked to their maximum ability (they are arresting as many people as they can possibly arrest in a day), then lowering the amount of substance abusers will not immediately lower policing cost. Therefore, that cost is not avoidable until you lower the strain on the policing below their maximum ability. Economists also reference effects of policing on increasing the societal costs of drugs. For example, drug enforcement may drive up black market prices and incentivize violent crime. That said, this number gives a good indication of how much the US spends on substance abuse.
| Corrections Cost Check (in Thousands) | ||
| ONDCP Budget for Corrections | Our Value | % Difference |
| 4,476.4 | 4,602.3 | 3% |
Table 35: Triangulation
In order to check our accuracy, we compared our replication to the NDIC methodology with ONDCP budget for corrections (ONDCP 2016). Our values were within 3% of their budget request, a comfortable margin.
Private Costs
| GDP By Industry | Percent of Lawyers Who Practice Criminal Law | % of Drug Arrests | Value to Drugs | Cost in Thousands |
| $241,000,000 | 2.25% | 24% | 1,301,400.00 | 1,301.40 |
Table 36: Private Legal Costs
Background and Methodology
We calculated the private cost associated with private legal defense by using the Bureau of Economic Analysis Statistics GDP by industry data on lawyers (BEA 2017). We then applied the percentage of lawyers who practice criminal law, as reported by the American Bar Association, to the attribution value to drugs by using the percent of arrests that are related to drugs (ABA 2017). We calculated a $1.3 billion cost in private legal fees.
Analysis
Few studies include this metric. One reason that it may not be included is that authors may disregard it as a private cost. Another reason could be that it is hard to accurately say how much money is directed towards drug and alcohol cases. The proxy of using the percentage of lawyers who practice criminal law and the attribution of drug crimes in arrests may not be indicative of the cost per case. Lastly, the legalization and decriminalization of drugs may impact this outdated attribution percentage.
Cost Due To Crime Victims
Background and Methodology
Technically, theft is considered a transfer payment. If nothing is created or destroyed, wealth is shifted from one person to another in society. Therefore, theft does not have a financial cost to society as long as the property is not destroyed. If it is destroyed, there is an economic cost (Harwood, NDIC 2011, Lapsey 2006, Moore 2005). Of course, there is quality of life costs and other intangible costs such as pain and suffering. In this portion of the analysis we are only concerned with property that is destroyed in crimes. We follow the NDIC methodology.
We adjusted the NDIC’s value of property loss for violent crime and property crime for inflation. We used the same percentage of destroyed property as NDIC. We updated the number of crimes using the Bureau of Justice Statistics 2015 data (BJS 2017). We found the value to be $884 million lost to crime victims, after discounting 12.29% from double counting.
| Violent | Property | Total | ||
| Number of Events (2015) | 5,006,620 | 14,611,040 | 19,617,660 | |
| Weighted Attribution Factors | 12% | 31% | ||
| Number of Drug Events | 608,710 | 4,458,609 | 5,067,319 | |
| Medical Costs Per Event | $43.27 | 0 | ||
| Subtotal | 26,338,248.66 | – | 26,338,249 | |
| Property cost Per Event | 134.046573 | 862.645707 | ||
| Damage Rate | 0.11 | $0.26 | ||
| Loss Per Event | 14.74512303 | $224.29 | ||
| Subtotal | 8,975,506.59 | 1,000,011,936.80 | 1,008,987,443 |
Table 37: Property Loss Due to Crime
Analysis
Theft due to Crime Victims was minimal in the total cost, making up 1% of the total crime and law enforcement costs and less than 0.15% of the total cost. One consideration is the crime trends in US. Violent crime has consistently decreased while drug costs have increased (BJS 2017). Therefore, we must approach crime attribution numbers skeptically.
IV. Research and Prevention
Summary
| IV. Research and Prevention | Costs in Thousands | Double Counting Adjustment | % of Total |
| Federal Research and Prevention | $1,526,054 | 1,338,467 | 86% |
| State and Local Research and Prevention | $241,045 | 211,415 | 14% |
| Subtotal | $1,767,099 | 1,549,883 | .27% |
Table 38: Research and Prevention
| Federal Research and Prevention | |
| Court Services and Offender Supervision Agency for DC | $23,586 |
| Prevention | $24 |
| Department of Defense | $121,589 |
| Drug Interdiction and Counterdrug Activities/OPTEMPO | $122 |
| Department of Education | $50,100 |
| Office of Elementary and Secondary Education | $50 |
| Federal Judiciary | $5,437 |
| Department of Health and Human Services | $1,147,616 |
| Administration for Children and Families | $19 |
| Centers for Disease Control and Prevention | $76 |
| Health Resources and Services Administration | $13 |
| Indian Health Service | $30 |
| National Institute of Health | $406 |
| Research and Development: Prevention | $406 |
| Substance Abuse and Mental Health Services Administration | $605 |
| Department of Homeland Security | $1,716 |
| United States Coast Guard | $2 |
| Research and Development | $2 |
| Department of the Interior | $1,000 |
| Bureau of Indian Affairs | $1 |
| Department of Justice | $4,681 |
| Drug Enforcement Administration | $2 |
| Office of Justice Programs | $3 |
| Department of Labor | $6,000 |
| Employment and Training Administration | $6 |
| Office of National Drug Control Policy | $116,241 |
| High Intensity Drug Trafficking Areas | $5 |
| Other Federal Drug Control Programs | $108 |
| Salaries and Expenses | $3 |
| Department of Transportation | $28,088 |
| Federal Aviation Administration | $17 |
| National Highway Traffic Safety Administration | $11 |
| Prevention | $1 |
| Research | $10 |
| Department of Veterans Affairs | $20,000 |
| Veterans Health Administration5 | $0 |
| Research And Development | $20 |
Table 39: Federal Research and Prevention
Federal Research and Prevention
Federal Research and Prevention was calculated by taking the Office of National Drug Control Policy’s 2017 Budget Request. It outlined all federal dollars towards drug use in the federal government and totaled $1.3 billion dollars
State and Local Research and Prevention
Rather than researching all 50 states’ programs on research and prevention, we adjusted Lewin 2013 values for state and local research. In their methodology for federal spending on alcohol, they found the total spent on prevention and research on drugs and alcohol and then applied a “66/33” rule. In which 66% of the spending is attributable to alcohol and 33% to drugs (Lewin 2013).
Using this rule, we adjusted the state research and prevention found by Lewin by dividing this value by .66 to give an indication on the state spending on research and prevention for drugs and alcohol. This value was adjusted to 2016 dollars and found state spending to equal $211 million dollars.
Analysis:
Research and Prevention spans across 12 federal agencies, but only makes up less than .25% of the total economic cost.
| Research and Prevention Triangulation (in Thousands) | ||
| Low | Our Value | High |
| $1,562,971 | $1,767,099 | $2,472,074 |
Table 40: Triangulation
In the triangulation above, the low value only reports on federal spending. We selected this because the NDIC 2011 report does not report on state spending. On the high bracket we display Lewin’s 2006 report of the total drug and alcohol spending on prevention and research adjusted for inflation. Inflating those numbers to 2016 values yields $2.5 billion. These two brackets add confidence to our $1.77 billion dollar estimate on federal and state spending on drug and alcohol research and prevention.
V. Fires
Summary
| Fires | Costs in Thousands | Double Counting Adjustment | % of Total |
| Fire Protection Costs | 1,292,558 | 1,133,673 | 72% |
| Property Damage/Destruction | 515,000 | 451,695 | 28% |
| Subtotal | 1,807,558 | 1,585,368 | 0.27% |
Table 41: Fires
Methodology and Background:
Both Lewin 2013 and Maine account for fire costs that are attributable to drugs. They cite a 1973 study by Berry & Boland that claims that 6.1% of all fire destruction and 11.2% of all fire protection costs can be attributed to alcohol. Maine’s study uses these full percentages to the fire damage and protection costs in Maine. Lewin’s 2006 report takes a more conservative approach by attributing 5% of both property damage and protection costs to alcohol (Main 2013, Lewin 2013).
We followed Lewin’s conservative approach and took 5% of all fire damage as reported by the American Fire Protection Association. To calculate fire protection cost, the 2013 census reported an average salary of $58,356 with 420,318 full and part time employees nationwide in the fire protective services. After inflating that value to 2016 dollars and applying the attributable faction we found that $1.2 billion of fire protection was attributed to alcohol.
Analysis:
The 1973 study is old and was conducted in a time in which smoking was of much greater prevalence. Much of the attribution to alcohol could be due to those who were smoking in bed and their alcohol abuse made them unresponsive to the fire. That said, more recent studies associate a large portion of fire deaths to substance abuse and the inability appropriately respond to fires. We should also note that “home-made” drugs such as methamphetamine may increase the proportion of fires attributed to drug use. Given that we use the conservative 5% value, we ignore applying an attribution to fire deaths and we are not considering the attribution rate for drugs, we are comfortable with the $1.8 billion valuation to fires.
| Fire Damage Triangulation (in Thousands) | ||
| Low | Our Value | High (11.2%) |
| 0 (ignored) | 1,767,099 | 3,410,329 |
Table 42: Triangulation
VI. Public Assistance and Social Services
Summary
| Public Assistance and Social Services | Costs in Thousands | Double Counting Adjustment | % of Total |
| Federal | 7,599,022 | 6,664,928 | 42% |
| State | 8,586,541 | 7,531,059 | 48% |
| Fetal Alcohol Syndrome Disorder costs and care | 1,789,450 | 1,569,486 | 10% |
| Subtotal | 17,975,012 | 15,765,473 | 2.73 |
Table 43: Public Assistance and Social Services
Methodology
Social welfare spending consists of administrative expenses and benefits paid to beneficiaries. The latter is a transfer payment that is not an actual cost to society. The administration of these benefits is considered a cost. Therefore, the administrative expenses related to the amount of benefits paid due to drugs and alcohol must be considered. We use the same methodology used by Lewin, Alaska, and Maine (Lewin 2013, Maine 2013, Alaska 2016). We use the drug and alcohol attribution rates used by Maine.
An exception to the social services transfer payment rule is the amount of money spent for Child Welfare and Protective Services and Fetal Alcohol Syndrome Disorder and Costs (Lewin 2013). The costs associated with these programs are considered in full with an applied attribution rate to alcohol and drugs. A Columbia Study in the National Center for Addiction and Substance Abuse cites that over 70% of child abuse and neglect cases are due to substance abuse (Columbia 2009). The Maine report uses a more conservative number from an analysis from the Maine Office of Family and Child Services that 52.6% of cases were substantiated to have been drug and alcohol abuse. We use the 52.6% attribution value.
| Program | Administration Costs | AAF/DAF | Admin costs do to Alcohol and drug |
| Administrative Expenses From: | |||
| Federal | |||
| Old Age, Survivors, and DisabilitiesInsurance (OASDI); | 6,229 | 2% | 105893 |
| Supplemental Security Income (SSI) | 5336 | 3% | 160080 |
| Temporary Assistance for NeedyFamilies (TANF) | 1154.32 | 5% | 60024.9 |
| Supplemental Nutrition AssistanceProgram (SNAP) | 750 | 5% | 39000 |
| Veteran’s compensation and pension** | 4730.80 | 2% | 80423.7 |
| Child Welfare Costs | 13600 | 52.60% | 7153600 |
| State | |||
| Temporary Assistance for NeedyFamilies (TANF) | 802.708257 | 5% | 41740.8 |
| Supplemental Nutrition AssistanceProgram (SNAP | 4500 | 5% | 234000 |
| Child Welfare Costs** | 15800 | 52.60% | 8310800 |
| Fetal Alcohol Syndrome Disorder costs and care | 1789.45 | 1 | 1789450 |
Table 44: Break down of Public Services
Analysis:
Child and Welfare Services make up the overwhelming majority of the costs from Public Assistance and Social Services. Fetal Alcohol Syndrome costs have been well documented (Lewin 2013). While the birth of a child may be documented as an alcohol related hospital expense, the medical care and associated special education needs associated with that disorder may not be considered. The double counting resulting from FAS pales in comparison to the amount of cost not considered from the children suffering from Neonatal Abstinence Syndrome (NAS) due to parents addicted to opiates.
VII. Traffic Collisions
Summary:
| Traffic Collisions | Costs in Thousands | Double Counting Adjustment | % of Total |
| Medical | 6,209,616 | 5,446,312 | 10.5% |
| Emergency Services | 262,379 | 230,126 | 0% |
| Market Productivity | 14,009,422 | 12,287,344 | 24% |
| Household productivity | 4,802,091 | 4,211,804 | 8% |
| Insurance Administration | 4,999,301 | 4,384,772 | 8% |
| Workplace Costs | 1,112,982 | 976,171 | 2% |
| Legal Costs | 2,654,913 | 2,328,564 | 4% |
| subtotal | 34,050,703 | 29,865,095 | 57% |
| Congestion Costs | 6,815,283 | 5,977,529 | 11% |
| Property Damage | 18,504,148 | 16,229,566 | 31% |
| Quality-adjusted life years (intangible) | – | – | 0% |
| Subtotal | 59,370,133 | 52,072,189 | 9% |
Table 45: Traffic Collisions
Methodology and Background:
The National Highway and Traffic Safety Administration did an analysis of the economic cost due to traffic accidents. Conducted in 2015, it calculated the total cost to society in 2010. This is a Cost of Illness study in itself, breaking down the cost of accidents over medical expenses, emergency services, market productivity, insurance administration, workplace, legal, congestion, and property costs. The report found that the traffic accidents caused $242 billion in economic loss and $593 billion in Quality of Life for a total loss of $836 Billion dollars. The study also states that 22% of these costs were due to alcohol (NHTSA 2015).
We adjusted the 2010 values to 2016 dollars using medical services CPI for medical and CPI for all values. We then applied the 22% attribution across the entire costs and found that alcohol was responsible for $59.3 billion dollars of economic loss.
Analysis:
When considering another cost of illness study, there is always the fear of double counting. We have to ask ourselves: “would medical services due to drunk driving already be considered under alcohol hospitalization costs?”, “would premature death productivity be already counted in productivity?”, and “are arrests due to drunk driving counted in crime costs?”. We believe the answer is yes and no. There may be some double counting, but this report is not all encompassing.
Some medical services may be counted an alcohol-induced incident, but others may not, and any follow on treatment associated with long term or recurring injuries will not be counted. Therefore, we feel comfortable that double counting will have a minimal impact. The NHTSA Study did not consider incarceration nor adjudication. Therefore, we are not concerned about double counting when it comes to crime costs nor productivity due to incarceration.
The 22% attribution only covers alcohol, not drugs and alcohol. Another NHTSA study stated that drugs and alcohol are responsible for 16% of all crashes. Using the assumption that impaired crashes may be more costly than unimpaired crashes, 22% may be a low estimation for the cost of drugs and alcohol. The low estimation by only considering alcohol alleviates fears of double counting.
One major concern is that this data is not indicative of substance abuse. Some people who drink and drive may make a gravely poor decision but these individuals may not be alcohol dependent. We did not consider the percentage of drunk driving cases that are due to substance abuse versus a casual user of alcohol. We feel comfortable with the assumption that the majority of drunk driving accidents are from abusers of alcohol.
VIII. Intangible Costs
Summary:
| Intangible Costs | Costs in Thousands | Double Counting Adjustment | % of Total |
| Death | 785,270,194 | 688,742,566 | 79% |
| Crime Victims | 35,716,806 | 31,326,395 | 4% |
| Quality of Life Lost | 31,662,798 | 27,770,717 | 3% |
| Traffic Deaths | 144,357,447 | 126,612,623 | 14% |
| Total: | 997,007,245 | 874,452,302 | 1 |
Table 46: Intangible Costs
Methodology and Background:
Cost of Illness studies attempt to quantify the economic loss associated with a disease and usually consist of direct and indirect costs. A major criticism of COI studies is that they fail to consider intangible costs such as the pain and suffering associated with an illness (Collins 2006, Moore 2005). Depending on the methodology, the intangible cost can be a huge portion of the percentage of the total cost. For instance, in the COI on motor vehicle crashes, Quality of Life Lost made up $593 billion of the $836 billion, 71% of the total cost and nearly 2.5 times that of direct and indirect costs.
Death
In the productivity section, we calculated the economic vale of premature mortality by considering the discounted value of all future market and household productivity. That process is the “Human Capital” approach. That value is substantially different than a “Willingness to Pay” approach.
Willingness to Pay is calculated by determining someone’s willingness to pay for a small reduction in the probability of dying (Health Econ 2017). Studies conducted by the Department of Transportation and Environmental Protection Agency yielded a value of a statistical life of $9.6 million in 2016 and $7.4 million in 2007, respectfully. In the NHTSA study, they used a value of life of $9.1 million in 2012 dollars. In order to calculate a wiliness to pay, we averaged the wiliness to pay from the DOT and EPA and used $9.4 million.
| Value of a Statistical Triangulation (in Thousands) | ||
| Low (EPA) | Our Value | High (NHTSA) |
| $8,705 | $9,366 | $9,792 |
Table 47: Triangulation
Table 48: Intangible Cost to Premature Death
Crime Victims
| Type of Crime | # Cases 2015 | Attribution | Cases Attributable To Drugs and Alcohol | Pain and Suffering Cost | Corrected Risk of Homicide Cost | Total Intangible Cost | Total Cost Due to Drugs and Alcohol |
| Murder | 11092 | 0.121581064 | 1348.6 | $8,442,000 | N/A | $8,442,000 | $11,384,688,393.77 |
| Rape/Sexual Assault | 431840 | 0.121581064 | 52503.6 | $198,212 | $1,430 | $199,642 | $10,481,917,052.34 |
| Aggravated Assault | 816760 | 0.121581064 | 99302.5 | $13,435 | $81,588 | $95,023 | $9,436,026,187.03 |
| Robbery | 578580 | 0.30515342 | 176555.7 | $4,976 | $17,599 | $22,575 | $3,985,744,147.98 |
| Motor Vehicle Theft | 564160 | 0.30515342 | 172155.4 | N/A | $262 | $262 | $45,104,702.53 |
| Arson | 41376 | 0.30515342 | 12626.0 | N/A | $5,133 | $5,133 | $64,809,401.14 |
| Household Burglary | 2904570 | 0.30515342 | 886339.5 | N/A | $321 | $321 | $284,514,969.15 |
| Larceny/Theft | 11142310 | 0.30515342 | 3400114.0 | N/A | $10 | $10 | $34,001,139.98 |
| Stolen Property | NA | NA | NA | N/A | N/A | $0 | |
| Vandalism | NA | NA | NA | N/A | N/A | $0 | |
| Forgery and Counterfeiting | NA | NA | NA | N/A | N/A | $0 | |
| Embezzlement | NA | NA | NA | N/A | N/A | $0 | |
| Fraud | NA | NA | NA | ||||
| Total Thousands | $35,716,805.99 |
Table 49: Crime Victims
Crime Victims
There are multiple methods to calculate the intangible costs to victims. Some studies have used jury compensation as a proxy. We chose to use the values from the 2010 report “The Cost of Crime To Society: New Crime Specific Estimates for Policy and Program Evaluation” (McCollister 2010). The study gives intangible values broken down by crime in 2010 dollars. We adjusted the values to 2016 values and then used crime statistics from the Uniform Crime Reporting (FBI 2017) and the attribution rates used by NDIC to determine the intangible value to victims of crimes attributable to drugs. We found that value to be $35 billion.
Quality of Life Lost
To determine the Quality of Life Lost to substance abusers, we took the number of substance abusers who need treatment but have not received it and multiplied it by the statistical value of a life. That number was discounted by the productivity lost due to substance abuse. Using this methodology, the value was $31 billion.
| Total # of Substance Abusers(Thousands) | Substance Abusers Who Receive Treatment(Thousands) | Substance Abusers Who Don’t Receive Treatment(Thousands) | Value of a LifeThousand | % Lost to Productivity | QALY |
| 21,664 | 2,346 | 19,318 | $9,366 | 17.5% | $31,662,798 |
Table 50: Quality of Life Lost
Traffic Quality of Life Lost
We applied the same 22% attribution from the economic cost of traffic accidents attributable to alcohol to the intangible Quality of Life Lost. The result was $144 billion.
| NHTSHA IntangibleCost (2010) | Inflation Adjustment | TotalCost 2016 | Attribution | Intangible dueto Alcohol |
| $593,652,000 | 1.10531 | $656,170,215 | 22% | $144,357,447 |
Table 51: Quality of Life Lost due to Traffic Accidents
Analysis:
The value of the statistical life varies between studies. While there are differences, nearly all economists recognize the limitations of the COI study and the need to capture these intangible costs. The accuracy of these costs is up for debate.
Cost of Treatment Vs. Non Treatment
We find that treating everyone who needed but has not received treatment results in a loss in direct and indirect economic costs. However, if intangible economic costs are considered, there is a positive economic gain to society. The avoidable cost per substance abuser was $13,500 in direct and indirect costs. If including intangible costs, this totals to $34,000. We found the cost of treatment to be $11,600 per user. If everyone who needed substance abuse received treatment, it would come at a cost of $224 billion and save over $368 billion in direct, indirect, and intangible costs, yielding a $142 billion dollar economic gain to society.
Methodology and Analysis:
First, we calculated the cost of treatment, a simple calculation of dividing the total cost of treatment by the number of individuals who received treatment that year. We found that the cost of treatment was $11,640 per substance abuser. This is in line with other studies. University of Pennsylvania’s 2005 meta-analysis, “Economic Benefits Of Drug Treatment: A Critical Review Of The Evidence For Policy Makers” found the cost of treatment to be $12,600-15,600 per abstinent case and $4,600-$6,100 for reduced drug use (French 2005). The average of these values was found to be $9,725, similar to our cost of treatment. Given that abstinence is more desired over drug reduction, we believe the value should be even closer to our estimation.
To calculate the cost to society, we first needed to identify avoidable costs. We used the findings from Collins and Lapsey as reported in the “International Guidelines for the Estimation of the Avoidable Costs of Substance Abuse” which states that 47.9% of total costs is avoidable (Collins 2006). Applying that percentage leaves $276 billion in direct and indirect costs and $695 billion in total societal costs.
| Avoidable Costs | ||
| Direct + Indirect | Direct + Indirect+ Intangible | |
| Total Costs | 578,177,561.28 | 1,452,629,863 |
| Avoidable (Canada, Australia) | 47.9% | |
| Avoidable Costs | 276,947,051 | 695,809,704 |
| Unavoidable Costs | 301,230,509 | 756,820,158 |
Table 52: Avoidable Costs
We calculated the avoidable cost per substance abuser by dividing the total avoidable costs by the number of substance abusers. The number of substance abusers was calculated by the number of people who needed treatment as reported by SAMHSA plus 50% of the people who received treatment. This accounts for the fact that relapse rates are roughly 50% on average of all treatment.
| Avoidable Costs Per Abuser | ||
| Direct + Indirect | Direct + Indirect+ Intangible | |
| Avoidable Costs | 276,947,051 | 695,809,704 |
| # of Substance Abusers | 20,491 million people | |
| Avoidable Cost Per person | 13,515 | 33,956 |
Table 53: Avoidable Costs per Abuser
| Calculation of New Cost in Treatment Scenario | ||
| Direct+ Indirect | Direct+ Indirect + Intangible | |
| Unavoidable Cost | 301,230,509.42 | 756,820,158.70 |
| New avoidable Cost Calculation | ||
| # Substance Abusers (50% Relapse) | 9,659 | |
| Cost per SA | 13,515 | 33,956 |
| New Avoidable Cost (#SA x Cost) | 130,546,658 | 327,989,162 |
| New Total (Avoidable + Unavoidable) | 431,777,167 | 1,084,809,321 |
| Old Total (Original Findings) | 578,177,561 | 1,452,629,863 |
| Benefit (Difference between old and New) | 146,400,393.62 | 367,820,541.63 |
Table 54: Treatment Scenario
| Cost of Treatment Calculation | ||
| Cost of Treatment | 11,641 | |
| Number Treated | 19,318 | |
| Total Cost | 224,879,646 |
Table 55: Treatment Costs
| ROI/CBA Calculation | ||
| Benefit | 146,400,393.62 | 367,820,541.63 |
| Cost | 224,879,646 | 224,879,646 |
| Difference (Benefit- Cost) | (78,479,252.65) | 142,940,895.36 |
| ROI (Cost to Benefits) | 0.65108 | 1.635 |
Table 56: ROI/CBA
To ensure that we are within an appropriate estimate, we checked our findings against two other sources. First, we inflated Lewin 2013 and NDICs report to 2016 dollars, added them together, used a 47.9% avoidable cost percentage, and divided through the number of substance abusers in 2007. We found the avoidable cost per person to be $12,740, slightly less than our estimation, but only a 6% difference. We used a second source, NECPAC and found that they had a $15,900 avoidable cost per substance abuser. Our estimation of avoidable cost per abuser is bracket by two different, independent sources, giving us confidence in our valuation.
| Avoidable Cost Per Substance Abuser (Direct + Indirect costs) | ||
| Low (NDIC, Lewin) | Our Value | High (NECPAC) |
| $12,740 | $13,600 | $15,900 |
Table 57: Triangulation
We must recognize that this methodology only provides a general assessment of the cost of treatment versus no treatment. Scaling a program to treat every single substance abuser is highly unlikely. Success rates and cost of treatment programs vary across substance abuse treatment types and programs. The longitudinal effects of scaling treatment would compound yearly as the number of substance abusers and the avoidable cost would reduce annually. Further study into the ROI and cost benefit of specific treatment programs would be fruitful to fully study this issue.
Resources
- Administrative Office of the United States Courts (2017). 2016 Federal Judicial Caseload Statistics: August 31, 2017. Washington, D.C.: United States Courts
- Alaska (2016). The Cost of Drugs in Alaska, 2016 Update. Retrieved from: http://mhtrust.org/mhtawp/wp-content/uploads/2014/10/Economic-Costs-of-Drug-Abuse-Final-4.24.17.pdf
- Akobundu, Ebere, Jing Ju, Lisa Blatt, and C. Daniel Mullins (2006) Cost-of-illness studies: a review of current methods. Pharmacoeconomics 24(9):869-890.
- AVERT (2017) “HIV And AIDS in the United States of America (USA)” Retrieved from: https://www.avert.org/professionals/hiv-around-world/western-central-europe-north-america/usa
- Avery, John. (2016). “The Cost of an Overdose”. MetroWest Daily News. Retrieved from: http://www.metrowestdailynews.com/news/20160521/cost-of-overdose
- Bacon, John (2017) “Ohio Councilman: After 2 Overdoses, no more EMS” USA TODAY. Retrieved from: https://www.usatoday.com/story/news/nation/2017/06/28/ohio-councilman-suggests-three-strikes-law-halt-overdose-rescues/434920001/
- Birnbaum, Howard, White Alan (2011). Societal Costs of Prescription Opioid Abuse, Dependence and Misuse in the United States. Retrieved from: https://www.asam.org/docs/advocacy/societal-costs-of-prescription-opioid-abuse-dependence-and-misuse-in-the-united-states.pdf
- Bureau of Economic Analysis (2017). GDP by Industry. https://www.bea.gov/iTable/iTable.cfm?ReqID=51&step=1#reqid=51&step=51&isuri=1&5114=a&5102=1
- Bureau of Justice Statistics (2016). Jail Inmates in 2015. https://www.bjs.gov/content/pub/pdf/ji15.pdf
- Bureau of Justice Statistics (2016). Prisoners in 2015. https://www.bjs.gov/content/pub/pdf/p15.pdf
- Bureau of Justice Statistics. Justice Expenditure and Employment Extracts. Retrieved from: https://www.bjs.gov/index.cfm?ty=pbse&sid=33
- Bureau of Labor Statistics (2017). American Time Use Survey. https://www.bls.gov/tus/
- Bureau of Labor Statistics (2017). CPI- All Urban Consumers (https://data.bls.gov/timeseries/CUUR0000SAM?output_view=pct_12mths)
- Bureau of Labor statistics. Medical Care: retrieved from: https://data.bls.gov/timeseries/CUUR0000SAM?output_view=pct_12mths
- Census (2013). US Census report on earnings by industry https://www2.census.gov/govs/apes/2013_summary_report.pdf
- Center for Budget and Policy Priorities (2017). Introduction to Supplemental Nutrition Assistance Program (SNAP). https://www.cbpp.org/research/policy-basics-introduction-to-the-supplemental-nutrition-assistance-program-snap
- Centers for Disease Control and Prevention (2017)“Hepatitis Statistics” Retrieved from: https://www.cdc.gov/hepatitis/statistics/index.htm
- Centers for Disease Control and Prevention . Impaired Driving Fact Sheet. https://www.cdc.gov/motorvehiclesafety/impaired_driving/impaired-drv_factsheet.html
- Centers for Disease Control and Prevention (2017). “CDC Wonder Online Databases” https://wonder.cdc.gov/
- Center for Medicare/Medicaid Services (2016) “National Health Expenditures 2015 Highlights” retrieved from: https://www.cms.gov/Research-Statistics-Data-and-Systems/Statistics-Trends-and-Reports/NationalHealthExpendData/Downloads/highlights.pdf
- Collins, David. Lapsey Helen (2002). Counting the Costs: Estimates of the social cost of drug abuse in Australia 1998-1999
- Collins, Lapsey, Brochu, Easton, Rhem, Single (2006). “International Guidelines for the Estimation of Avoidable Costs of Substance Abuse” November 2006.
- Clabaugh 2011. Cost-of-illness studies in the United States: a systematic review of methodologies used for direct cost. Value in Health 11(1):13-21.
- Columbia University (2009). Shoveling it Up II: The Impact of Substance Abuse on Federal, State, and Local Budgets.
- Department of Health and Human Services. “The ADDS Cost Study: Cost of Substance Abuse Treatment in the Specialty Sector” Retrieved from: http://www.dldocs.stir.ac.uk/documents/adsscosts.pdf
- Department of Health and Human Services (2016). “The Opioid Epidemic in the U.S.” Retrieved from: https://www.hhs.gov/sites/default/files/2017-opioids-infographics.pdf
- Department of Health and Human Services (2012). “Report to Congress Evaluation of Hospita’s Ambulance Data on Medicare Cost Reports and Feasiblity of Obstaining Cost Data from All Ambulance Providers and Suppliers” CMS. Retrieved from: https://www.cms.gov/Medicare/Medicare-Fee-for-Service-Payment/AmbulanceFeeSchedule/Downloads/Report-To-Congress-September-2015.pdf
- Drug and Alcohol Services Information System (2004). “Alcohol and Drug Services Study (ADSS) Cost Study. SAMSHA retrieved from: http://archive.samhsa.gov/data/2k4/costs/costs.pdf
- Drug Abuse Warning Network (2011). DAWN 2011 Emergency Department Excel Files retrieved from: https://www.datafiles.samhsa.gov/study/drug-abuse-warning-network-dawn-2011-nid13586
- gov (2017) “Drug-Related Hospital Emergency Room Visits”
- gov. retrieved from: https://www.drugabuse.gov/publications/drugfacts/drug-related-hospital-emergency-room-visits
- gov (2017) “Overdose death rates” Retrieved from: https://www.drugabuse.gov/related-topics/trends-statistics/overdose-death-rates
- Department of Transportation. Value of a Statistical Life. https://www.hhs.gov/opioids/sites/default/files/2021-02/opioids-infographic.pdf
- Environmental Protection Agency: Value of a Statistical Life. https://www.epa.gov/environmental-economics/mortality-risk-valuation
- French, Belenko, Patapis (2005): Economic Benefits of Drug Treatment: A Critical Review for Policy Makers. University of Pennsylvania.
- Florence, Curtis, Zhou Chao (2016). The Economic Burden of Prescription Opiod Overdose, Abuse, and Dependence in the United States, 2013. Retrieved from: http://journals.lww.com/lww-medicalcare/Abstract/2016/10000/The_Economic_Burden_of_Prescription_Opioid.2.aspx
- Federal Bureau of Investigation. Uniform Crime Reporting. https://ucr.fbi.gov/
- Grosse (2009): 2009 Economic Productivity by Age and Sex: 2007 Estimates for the United States.
- Government Accountability Office (2012). “Cost and Medicare Margins Varied Widely; Transports of Beneficiaries have Increased”. Retrieved from: http://www.gao.gov/products/GAO-13-6
- Harwood (1994) Economic Costs to Society of Alcohol and Drug Abuse and Mental Illness: 1980. Report to Alcohol, Drug Abuse, and Mental Health Administration. Pub No. RTI/2734/00-01FR. Research Triangle Park, NC: Research Triangle Institute.
- Harwood (1998). The Economic Costs of Alcohol and Drug Abuse in the United States–1992. Rockville, MD: National Institutes on Drug Abuse http://archives.drugabuse.gov/economiccosts/Index.html Accessed November 1, 2010.
- HealthEcon (2017). Value of Life, Human Capital Approach, Willingess to Pay Approach. Retrieved from: https://healthecon.wikispaces.com/Value+of+life+-%26nbsp%3Bhuman+capital+approach%3F+Willingness+to+pay+approach%3F
- Hodgson, Thomas and Meiners (1982). Cost-of-illness methodology: a guide to current practices and procedures. Milbank Memorial Fund Quarterly: Health and Society 60(3):429-462.
- Johns Hopkins University (2017). “Johns Hopkins Pilots Study on EMS treatment of Substance Abusers.” Retrieved from https://hub.jhu.edu/gazette/2014/september-october/focus-baltimore-city-ems/
- Knowlton, Amy. (2013). EMS Runs for suspected opioid overdose: Implications for surveillance and prevention. Retrieved from: https://www.ncbi.nlm.nih.gov/pmc/articles/PMC3682796/
- Lewin Group (2013). The Economic Cost of Excessive Alcohol Consumption in the United States, 2006. Retrieved from: http://www.lewin.com/content/dam/Lewin/Resources/Site_Sections/Publications/CDC_Report_Rev.pdf
- Lupton, C. (2004) “Cost of Fetal Alcohol Spectrum Disorders” https://www.ncbi.nlm.nih.gov/pubmed/15095471
- Main (2013). The Cost of Alcohol and Drugs in Maine, 2010. Substance Abuse and Mental Health Services. Retrieved from: http://www.maine.gov/dhhs/samhs/osa/pubs/data/2013/Cost2010-final%20Apr%2010%2013.pdf
- McCollister, Kathryn. French, Michael (2010) ““The Cost of Crime To Society: New Crime Specific Estimates for Policy and Program Evaluation” National Insititue of Health
- National Drug Intelligence Center (NDIC) (2011). The Economic Impact of Illicit Drug Use on American Society” Retrieved from: https://www.justice.gov/archive/ndic/pubs44/44731/44731p.pdf
- National Fire Protection Association (2017). Fire in the US. http://www.nfpa.org/news-and-research/fire-statistics-and-reports/fire-statistics/fires-in-the-us/overall-fire-problem/structure-fires
- National Highway Transportation Safety Administration. https://crashstats.nhtsa.dot.gov/Api/Public/ViewPublication/812013
- National Highway Transportation and Safety Administration. The Economic and Societal Impact of Motor Vehicle Crashes, 2010. https://crashstats.nhtsa.dot.gov/Api/Public/ViewPublication/812013
- Surgeon General ADdiciton is a bigger health Problem than Cancer. Retrieved from: https://www.google.com/url?sa=t&rct=j&q=&esrc=s&source=web&cd=5&ved=0ahUKEwjkm9CxicPWAhXBYyYKHemxBFsQFgg7MAQ&url=http%3A%2F%2Fwww.npr.org%2Fsections%2Fhealth-shots%2F2016%2F11%2F17%2F502402409%2Fsurgeon-general-murthy-wants-america-to-face-up-to-addiction&usg=AFQjCNELm1lzB5WU8qjC4YoRd0d_4sri5w
- National Survey of Substance Abuse Treatment Services (N-SSATS): 2016. “Data on Substance Abuse Treatment Facilities. SAMHSA. Retrieved from: https://www.samhsa.gov/data/sites/default/files/2016_NSSATS.pdf
- Office of Family Assistance (2015). https://www.acf.hhs.gov/ofa/resource/tanf-financial-data-fy-2015
- Office of National Drug Control Policy (2001) The Economic Costs of Drug Abuse in the United States, 1992-1998. NCJ No. 190636.Washington, D.C.: Executive Office of the President http://web.archive.org/web/20070606015604/http://www.whitehousedrugpolicy.gov/publications/pdf/economic_costs98.pdf
- Office of National Drug Control Policy (2004) The Economic Costs of Drug Abuse in the United States, 1992-2002. NCJ No. 207303. Washington, D.C.: Executive Office of the President http://www.ncjrs.gov/ondcppubs/publications/pdf/economic_costs.pdf
- Office of National Drug Control Policy (2016). FY 2017 Budget Request. https://obamawhitehouse.archives.gov/sites/default/files/ondcp/policy-and-research/fy2017_budget_summary-final.pdf
- Rice, Dorothy (1967) Estimating the cost of illness. American Journal of Public Health, Nations Health 57:424–440.
- Ruhm, Christopher (2017) “Geographic Variation in Opioid and Heroin Involved Drug Poisoning Mortality Rates” University of Virginia.
- Sacks (2015). 2010 National and State Costs of Excessive Alcohol Consumption. American Journal of Preventive Medicine. Retrieved from: https://www.ncbi.nlm.nih.gov/pubmed/26477807
- State Policy Advocacy and Reform Center. Child Welfare Financing in the United States. https://childwelfaresparc.files.wordpress.com/2013/02/child-welfare-financing-in-the-united-states-final.pdf
- Social Security Administration (2017). Social Security Administrative Expenses. https://www.ssa.gov/oact/STATS/admin.html
- Social Security Administration (2017). Annual Report of the Supplemental Security Income Program. https://www.ssa.gov/oact/ssir/SSI17/ssi2017.pdf
- Social Security Administration. FY 2016 Presidents Budget. https://www.ssa.gov/budget/FY16Files/2016KT.pdf
- Talbot, Margaret. (2017) “The Addicts Next door”. The New Yorker. Retrieved from: https://www.newyorker.com/magazine/2017/06/05/the-addicts-next-door
- The Henry J. Kaiser Family Foundation (2017). “Health Insurance Coverage of the Total Population” retrieved from: http://www.kff.org/other/state-indicator/total-population/?currentTimeframe=0&sortModel=%7B%22colId%22:%22Location%22,%22sort%22:%22asc%22%7D
- The Henry J. Kaiser Family Foundation (2017). “Total REtrail Sales for Prescription Drugs Filled at Pharmacies” http://www.kff.org/health-costs/state-indicator/total-sales-for-retail-rx-drugs/?currentTimeframe=0&sortModel=%7B%22colId%22:%22Location%22,%22sort%22:%22asc%22%7D
- Treatment Episode Data Set: Admissions (2017). https://www.datafiles.samhsa.gov/study-series/treatment-episode-data-set-admissions-teds-nid13518
- Treatment Episode Data Set: Discharge (2017). https://www.datafiles.samhsa.gov/study-series/treatment-episode-data-set-discharges-teds-d-nid13520
- US News. 2016. The Staggering Costs, Monetary and Otherwise, of Substance Abuse. US News and World Report. Retrived from: https://www.usnews.com/news/at-the-edge/articles/2016-12-19/drug-and-alcohol-abuse-cost-taxpayers-442b-annually-new-surgeon-generals-report-finds
- Veterans Benefits Administration. Fiscal Year 2016. https://www.benefits.va.gov/REPORTS/abr/ABR-All_Sections_FY16_06292017.pdf