
Table of Contents
Introduction
Detailed Approach
I. DIRECT TANGIBLE COSTS
II. INDIRECT TANGIBLE COSTS
III. INTANGIBLE COSTS
IV. Cost of Treatment vs. No Treatment
V. Opioids
Conclusion
References
Complete Form to download PDF
Executive Summary
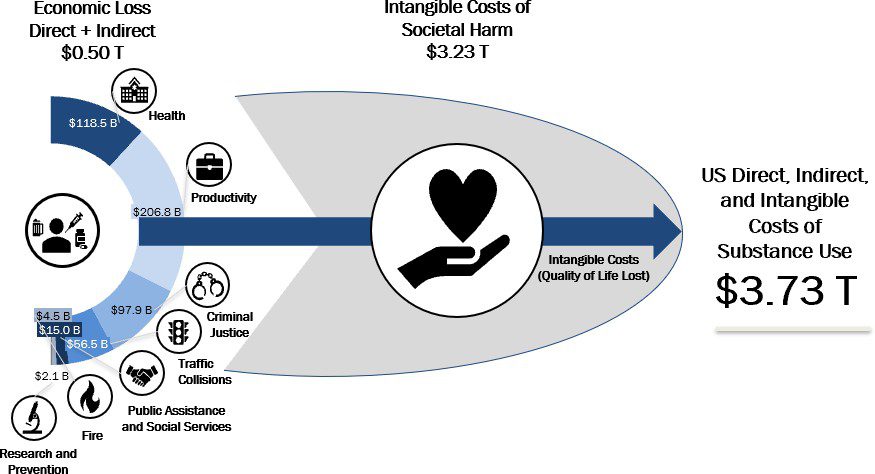
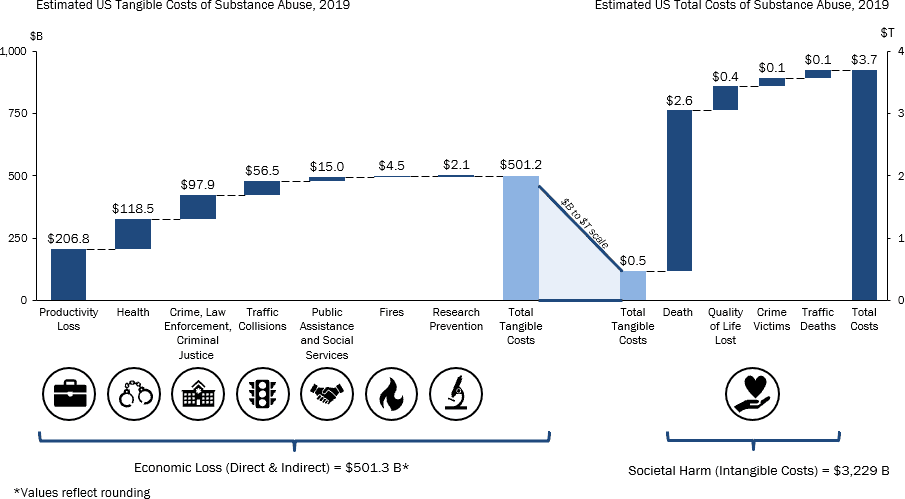
The current estimated economic cost of substance abuse disorder in the United States is approximately $3.73 T annually, including $0.50 T in tangible measured costs and $3.23 T in intangible costs, a figure that consumes the equivalent of the combined GDP of 45 of the 50 US States and is larger than the combined GDP of California, Texas, New York, Florida, Illinois, Pennsylvania, and Ohio.¹ In this work, we identify and quantify the varied ways in which substance abuse disorder imposes direct and indirect costs on communities in the United States so that policymakers can have an updated and clear vision of how their investment in solutions to substance abuse disorder issues can deliver massive quantifiable economic benefits that coincide with their priceless impacts on human life.
Our analysis divides the costs of substance abuse disorder into three main categories – tangible direct costs, tangible indirect costs, and intangible costs. Tangible costs ($0.50 T, 13.4%) are those that can be measured directly and/or estimated based on economic activity, including, for example, direct healthcare expenditures for substance abuse disorder treatment and the treatment of health conditions exacerbated or caused by substance abuse, and indirect costs including, for example, productivity loss due to premature mortality or absenteeism due to morbidity, criminal justice activity, public assistance expenditures, and expenses associated with substance abuse-related traffic collisions and fires.
The intangible costs of substance abuse disorder ($3.23 T, 86.6%) include losses that are not frequently quantified outside of actuarial analysis, social science research, or personal injury torts, such as the economic value assigned to loss of life, injury, and reduced quality of life. Among these, the most significant examples of the intangible costs of substance abuse disorder are those associated with the loss in quality of life of those with substance abuse disorders who do not receive treatment ($0.39 T) and the pain and suffering of deaths, traffic deaths, and victims of violent crime associated with substance abuse disorder ($2.84 T).
1 https://apps.bea.gov/regional/histdata/releases/0519gdpstate/index.cfm
Economic Cost of Substance Abuse Disorder in the United States (2019), Summary View
Summary of Key Findings
| Cost ($M) | Adj. for Double Counting² | % | |
|---|---|---|---|
| Health | $135,457 | $118,535 | 3.20% |
| Productivity Loss | $236,268 | $206,753 | 5.50% |
| Crime, Law Enforcement, Criminal Justice | $111,855 | $97,882 | 2.60% |
| Traffic Collisions | $64,599 | $56,529 | 1.50% |
| Public Assistance and Social Services | $17,155 | $15,012 | 0.40% |
| Fires | $5,106 | $4,468 | 0.10% |
| Research Prevention | $2,398 | $2,098 | 0.10% |
| Tangible (Direct and Indirect) Costs | $572,838 | $501,277 | 13.40% |
| Death | $2,943,951 | $2,576,182 | 69.10% |
| Crime Victims | $158,190 | $138,428 | 3.70% |
| Quality of Life Lost | $441,078 | $385,977 | 10.30% |
| Traffic Deaths | $147,181 | $128,795 | 3.50% |
| Intangible Costs | $3,690,400 | $3,229,382 | 86.60% |
| Total Costs | $4,263,237 | $3,730,658 | ##### |
2 SAMHSA’s NSDUH 2018 Survey indicated that 12.5% of substance abusers abuse both alcohol and drugs so an adjustment was applied to avoid double counting of those using both alcohol and drugs
- Health
- The direct healthcare costs associated with substance abuse disorders total $118.5 B annually, mainly driven by hospital inpatient and outpatient spending (36%), followed by the costs of treatment programs (34%)
- Productivity Loss
- The indirect productivity loss costs associated with substance abuse disorders total ~$207 B annually, mainly driven by health-related categories (89%) such as premature death
- Productivity lose due to crime (11%) such as incarceration and absenteeism, and diminished productivity and victims of crime, are also contributing factrs
- Crime, Law Enforcement, Criminal Justice
- The indirect and direct costs due to crime, law enforcement, and criminal justice total ~$98B annually, driven by law enforcement costs (76%)
- The costs of private lawyers and security (23%) due to substance abuse disorder were also considered
- Traffic Collisions
- The total cost of direct tangible traffic collisions related to substance abuse is ~$57B, with productivity (32%) and property damage (31%) as categories with the highest costs
- Public Assistance and Social Services
- The total cost of public assistance and social service costs related to substance abuse is ~$15B, with Federal (42%) and State (35%) program expenditures making up the largest costs
- Federal and State programs include OASDI, SSI, TANF, SNAP, VA, and Child Welfare
- Donations to charity related to substance abuse (14%) were also considered
- Fires
- The cost of fire due to substance abuse is $4-5B, composed of two main costs:
- Fire Protection – costs of fire protection service workers (86%)
- Property Damage due to fires (14%)
- The cost of fire due to substance abuse is $4-5B, composed of two main costs:
- Research Prevention
- The total Federal (95%) and State (5%) expenditure on substance abuse research and prevention is ~$2B
- Intangible Costs
- The intangible cost of substance abuse ($3.2T) measures the non-financial welfare losses such as reduced quality of life, death, and injury
- The highest intangible cost was death from substance abuse (80%), which was based on the value of a statistical life or the willingness for a person to pay to avoid death
- The second highest intangible cost was quality of life lost (12%), which was based on the loss of productivity of substance abuse users who needed treatment, but did not receive it
- Cost vs. No Cost Treatment
- The total benefit to society of treatment for substance abuse disorder versus no treatment is $534.6 B.
- Opioids
- The cost of non- medical opioid use to society is $188.4 B. This includes healthcare, mortality, criminal justice, child and family assistance, education, and productivity loss.
Introduction
Substance abuse disorder and its related public health issues are an endemic problem in the United States. According to the National Survey on Drug Use and Health (NSDUH), an annual survey on the use of illicit drugs and alcohol, substance abuse disorders, and mental health issues among the civilian and noninstitutionalized United States population, stated an estimated 20 million people aged 12 and above were battling a substance abuse disorder in 2017.³ Among adults struggling with substance abuse disorder that year, 74% were also contending with an alcohol use disorder.⁴
The direct health impact of substance abuse disorder alone is staggering as it is associated with a number of adverse health conditions and public health concerns, such as cardiovascular disease and pregnancy complications; abundant research documents the linkage of drug misuse with abnormal cardiovascular functioning, including abnormal heart rate and heart attacks,⁵ and prenatal drug use is known to result in miscarriage, premature birth, low birth weight, and fetal drug dependency.⁶ These direct, tangible and measurable health costs are further increased by the enormous intangible social and economic costs related to the social impact of substance abuse, including domestic violence, child abuse, and motor vehicle accidents. Finally, substance abuse disorder contributes to a host of other social problems with serious economic effects, including lost labor productivity, decreased quality of life, and premature death.
While some progress has been made to address substance abuse disorder in the United States, including increased prevention, treatment, and research efforts, substance abuse disorder continues to play a large role in the burden of disease in the United States and continues to have a severe impact on the economy. As decisionmakers work to address the complex economic, health, and social issues associated with substance abuse disorder, information on the scope of the issues and objective measures of their impacts are crucial to drive thoughtful decisions about the value of investing in solutions.
In the following sections, we offer a detailed analysis of the economic impact of substance abuse disorder in the United States, estimating the costs in terms of health spending, productivity loss, crime, law enforcement and criminal justice spending, and the contributions of traffic collisions, public assistance and social services activities, fires, research on prevention, and other intangible costs, and analyze the economic yield of the cost of treatment versus no treatment. Due to the recent and ongoing major public focus on the opioid use crisis in the United States, we specifically analyzed this issue in an additional section.
3 https://www.samhsa.gov/data/report/2017-nsduh-annual-national-report
4 American Addiction Centers
5 https://www.drugabuse.gov/publications/health-consequences-drug-misuse/cardiovascular-effects
6 https://www.drugabuse.gov/publications/health-consequences-drug-misuse/prenatal-effects
Detailed Approach
To conduct this analysis, we reviewed a comprehensive set of existing source materials including independent private and public sector research on the costs of substance abuse disorders in a variety of sectors, including those in the healthcare, legal, social science, and public policy spheres. We incorporated our previous framework on this subject (RCA’s September 2017 Report on the Economic Cost of Substance Abuse) in approaching the problem, further enhancing this perspective with additional spending categories and updated analysis using current primary source data and updated methodologies. A list of major primary and secondary sources can be found in the appended material.
I. DIRECT TANGIBLE COSTS
Health
Summary
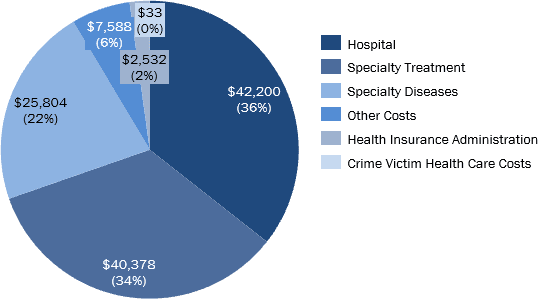
The direct healthcare costs associated with substance abuse disorders total $118.5 B annually, mainly driven by hospital inpatient and outpatient spending, followed by the costs of treatment programs and treatment for specialty diseases.
| Categories | Cost ($M) | Adjusted for Double Counting | % of Category |
| Hospital | $48,224 | $42,200 | 35.60% |
| inpatient | $29,972 | $26,228 | 22.10% |
| outpatient (Emergency Visits) | $18,252 | $15,972 | 13.50% |
| Other Costs | $8,671 | $7,588 | 6.40% |
| Ambulance | $3,580 | $3,133 | 2.60% |
| Prescription Drugs | $1,097 | $960 | 0.80% |
| Nursing Homes | $1,680 | $1,470 | 1.20% |
| PCP | $1,616 | $1,414 | 1.20% |
| Other Health Professional, Durable Goods | $698 | $611 | 0.50% |
| Specialty Diseases | $29,488 | $25,804 | 21.80% |
| Hepatitis C Treatment | $1,224 | $1,071 | 0.90% |
| AIDS ART Treatment | $1,733 | $1,517 | 1.30% |
| Mental Health Treatment | $19,519 | $17,081 | 14.40% |
| Hypertension Treatment | $7,011 | $6,135 | 5.20% |
| Specialty SUD Treatment | $46,142 | $40,378 | 34.10% |
| Community Based Specialty Treatment | $38,975 | $34,106 | 28.80% |
| Federal -Provided Specialty Treatment | $7,167 | $6,272 | 5.30% |
| Health Insurance Administration | $2,893 | $2,532 | 2.10% |
| Crime Victim Health Care Costs | $37 | $33 | <0.1% |
| Total | $135,457 | $118,535 | ##### |
Methodology and Analysis
Hospital
For the inpatient and outpatient/emergency visit costs due to substance abuse disorder, we used the 2017 National inpatient Sample (NIS) and Nationwide Emergency Department Sample (NEDS) datasets from the Healthcare Cost and Utilization Project (HCUP) and adjusted the identified costs to project 2019 values using the CPI for Medical Services.
The NIS data set includes all payers and a sample size of more than 7 million annual hospital stays; HCUP applies a weighting factor to each recorded discharge to represent more than 35 million hospitalizations nationally in community hospitals in the US. A cost-to-charge ratio based on Center for Medicare and Medicaid Services (CMS) data enables inference of the associated estimated costs.
In our analysis we compiled the weighted cost-to-charge ratio and the weighted inpatient visit counts associated with 10th Revision International Statistical Classification of Diseases and Related Health Problems (ICD-10) codes indicating alcohol and substance abuse disorders or fetal alcohol syndrome were recorded as the primary through quintenary diagnoses. We filtered duplicate events to prevent double counting and excluded ICD-10 codes that could be tangential to substance abuse disorder (i.e.,, Hepatitis C, tuberculosis, and others) from the analysis due to the likelihood that medical events driven by those conditions in the setting of substance abuse disorder would be captured in the visits where substance abuse disorders were noted to be in the first through fifth ICD-10 classifications.
Table 1.1: inpatient Total Charge – Cost-to-charge Ratio Adjusted (Weighted), ($ M, 2017)
| Description | ICD-10 | DX 1 | DX 2 | DX 3 | DX 4 | DX 5 |
| Alcohol related disorders | F10 | $2,930 | $5,822 | $6,239 | $6,800 | $6,793 |
| Opioid Related Disorders | F11 | $2,157 | $1,226 | $1,298 | $1,379 | $1,324 |
| Cannabis Related Disorders | F12 | $385 | $1,003 | $790 | $787 | $702 |
| Sedative, Hypnotic, or Anxiolytic Related Disorders | F13 | $41 | $458 | $461 | $419 | $365 |
| Cocaine Related Disorders | F14 | $72 | $69 | $58 | $54 | $45 |
| Other Stimulant Related Disorders | F15 | $69 | $190 | $183 | $166 | $147 |
| Hallucinogen Related Disorders | F16 | $97 | $212 | $211 | $181 | $180 |
| Nicotine Dependence | F17 | $7 | $10 | $8 | $7 | $3 |
| Inhalant Related Disorders | F18 | $5 | $2,542 | $3,104 | $3,681 | $3,914 |
| Other Psychoactive Substance Related Disorders | F19 | $1 | $1 | $1 | $2 | $1 |
| Fetal Alcohol Syndrome (Dysmorphic) | Q860 | ⁷ | $1 | $8 | $4 | $5 |
Note: Duplicates have been removed
7 Sample size too small
The total derived medical spending cost was $28.6B, which was adjusted to a 2019 value of $30.0B accounting for inflation. A similar broader approach in which the top ten ICD-10 designations for a visit were scanned for substance abuse disorders brought the total adjusted estimated cost to $56.1B ($58.8 for 2019).
outpatient Emergency Visits
Table 1.2: Emergency Visits Total Charge – Cost-to-Charge Ratio Adjusted (Weighted), in $ M (2017)
*Excluded fetal alcohol syndrome due to small sample size
The NEDS data does not come with a cost-to-charge ratio file. Instead, we calculated the charge-to-charge ratio for substance abuse disorders and fetal alcohol syndrome, by payer, based on the NIS sample and applied it to the total weighted Emergency Department (ED) charges. The total cost of ED visits with substance abuse disorders as one of the first five listed diagnoses was $17.4 B in 2017, adjusted to $18.3 B for 2019.
The NEDS data also breaks out the inpatient charges due to ED admissions. We found that that the inpatient cost for patients admitted from the ED due to substance abuse disorder was $23.3 B (78% of total inpatient costs due to substance abuse disorder).
There are drawbacks to using the cost-to-charge ratio and a weighted sample to represent a nationwide view of payment totals for substance abuse disorders, however, using unadjusted total charges would substantially overestimate actual payments, due to the gap between published prices and realized payments; furthermore, an unweighted sample would underrepresent the total across the United States.
Other Costs Ambulance
Using the Health Care Cost Institute’s 2017 Health Care Cost and Utilization Report we were able to estimate the total volume of ambulance rides in 2019.
Table 1.3: Estimated Number of Ambulance Rides
| Annual Utilization per 1000 People Adjusted for Service-Mix Intensity (2017) | 2019 BLS Annual Estimate of US Resident Population (2019) | Implied Number of US Ambulance Rides, 2019 |
| 49.9 | 328,239,523 | 16,379,152 |
A Marwood Group market study on Ground Ambulance services indicated that Medicare is about 37% of the payer mix and Commercial is 17%. We applied this ratio to the US resident population to calculate the weighted cost of an ambulance ride based on the CMS Medicare average payment for 2019 and the Health Care Cost Institute’s average payment for an ambulance ride adjusted to 2019.
Table 1.4: Total Spend on Ambulance Rides
| Medicare (CMS) | Commercial (Health Care Cost Institute) | Weighted Average | Total Spend 2019 ($M) | |
| Average Payment Per Ride | $445 | $767 | $546 | $8,950 |
| Ratio of Rides | 69% | 31% |
After reviewing multiple studies, we applied the low end 40% attribution rate from Johns Hopkins University⁸ to drugs or alcohol yielding an estimated cost of substance abuse disorders associated ambulance rides to be
$3.6B; including government and commercial payers. Other studies indicated a wide range of attribution rates:
| Source | % EMS calls |
| Brown University (2005)⁹ | 23% due to alcohol and substance abuse |
| South Korea, Van Dillen, Kim (2017)¹⁰ | 43% intoxicated |
| State of CT Dept of Public Health (2016)¹¹ | 7% one or more indicators of possible toxicity |
| UK Institute of Alcohol Studies (2015)¹² | 35% alcohol-related ambulance journeys |
| Denver Health Paramedic Division (2012-2014)¹³ | 30% alcohol consumption, 29% alcohol as a contributing factor |
| North East Ambulance Service, England (2003-2010) ¹⁴ | 10% calls were alcohol related |
| Zurich, Switzerland (2012, 10 year)¹⁵ | 73% alcohol use present |
| England and Scotland (2014-2015)¹⁶ | 20.15% alcohol related, 1.04% drug related |
8 https://hub.jhu.edu/gazette/2014/september-october/focus-baltimore-city-ems/
9 https://www.browndailyherald.com/2005/02/24/23-of-ems-calls-alcoholrelated/
10 https://doi.org/10.1177/0300060517718116
11 https://portal.ct.gov/-/media/Departments-and- Agencies/DPH/dph/ems/pdf/CEMSTARS/2016OEMSAnnualDataReportpublic.pdf?la=en 12 http://www.ias.org.uk/uploads/Alcohols_impact_on_emergency_services_full_report.pdf
13 https://www.ncbi.nlm.nih.gov/pmc/articles/PMC6360267/
14 https://www.ncbi.nlm.nih.gov/pubmed/22262506/
15 https://www.ncbi.nlm.nih.gov/pubmed/22838502/
16 https://sjtrem.biomedcentral.com/articles/10.1186/s13049-019-0611-9/tables/1
Prescription Drugs
The US Substance Abuse and Mental Health Services Administration (SAMHSA)’s Projections Of National Expenditures For Treatment Of Mental And Substance Abuse Disorders, 2010-2020” predicted SUD spending would grow to $42.1B in 2020, increasing at an average of 5.8% percent annually for all-health spending and 5.1% for SUD treatment spending; one reason for the slower M/SUD treatment cost growth is the large number of prescription drugs lost their patent protections in that period of time.
Table 1.5: Distribution of Substance Abuse Disorder Spending by Provider Type
| Provider Type | Projected 2020 | Calculated Spend ($M) |
| Insurance Administration | 7% | $2,940 |
| Retail Prescription Drugs | 4% | $1,680 |
| Specialty SA Centers | 33% | $13,860 |
| Specialty MH Centers | 4% | $1,680 |
| Long Term Care | <3% | |
| Office Based Professionals | 19% | $7,980 |
| Hospitals | 30% | $12,600 |
| Total SUD Spending | $42 B |
The total projected spend on retail prescription drugs is $1.68 B. Since this report was published in October 2014 the projections may be outdated. Another study from August 2014 estimated that the amount of retail prescription drugs treatment spending for substance abuse disorders would reach $1.8 B in 2020.17
Nursing Homes
Table 1.6: Total Spend on Nursing Homes due to Substance Abuse Disorder
| CMS Projected 2019 Spend ($M) | Attribution % | Total Spend ($M) |
| $175,100 | 0.92% | $1,616 |
We used the projected total national expenditure on Nursing Care Facilities and Continuing Care Retirement Communities from CMS’ National Healthcare Expenditure Projections data. The attribution rate due to substance abuse disorder was calculated from the NIS 2017 dataset. We divided the weighted number of visits that had substance abuse disorder as a primary diagnosis and were discharged to a nursing facility by the weighted number of visits that were discharged to a nursing facility to obtain a 0.92% attribution rate. This is conservative given that as many as 49% of patients in nursing homes may have a history of an alcohol abuse problem.18,19
Primary Care Spending
We applied the annual utilization per people for outpatient visits from the Health Care Cost Institute to the US Census estimate of the US adult population to get the estimated number of outpatient visits in the US. Using the 2016 National Ambulatory Medical Care Survey from the CDC, we calculated that 54.5% of all US physician office visits were primary care visits.
Table 1.7: Estimated Number of PCP Visits
| Annual Utilization per 1000 People Adjusted for Service-Mix Intensity (2017) | 2019 US Census Annual Estimate of Resident Population 18 years + (2019) | Estimated Number of Adult outpatient Visits in the US in 2019 | Estimated Number of Primary Care Visits in the US in 2019 |
| 362.86 | 254,713,870 | 92,425,475 | 27,452,677 |
We then obtained the average of the highest and lowest paying primary care visits from CMS and the Health Care Cost Institute and applied that to the total number of visits in the US to estimate primary care spending. A 2017 study indicated that 36.0% met criteria for any 12-month SUD (14.2% mild disorder, 21.8%
17 https://www.healthaffairs.org/doi/pdf/10.1377/hlthaff.2014.0163
18 https://www.tandfonline.com/doi/abs/10.1300/J020v25n03_07
19 https://www.aging.com/alcohol-abuse-amongst-the-elderly-a-complete-guide/
moderate/severe disorder) and 13.9% was due to alcohol and 14.0% was due to “any drug use,”20 therefore we applied those as our attribution rates for substance abuse disorder. The study included 2,000 adults from primary care practices between 2014-2015. Their study defined SUD as meeting ≥2 DSM criteria for a given substance; mild SUD was defined as meeting 2–3 criteria; and moderate/severe SUD was defined as meeting
≥4 criteria.
Table 1.8: Total Spend on PCP Visits due to Substance Abuse Disorder
| Type of Primary Care Visit | Medicare (CMS) | Commercial (HCCI) | Average Payment per Visit | Total Spend on Primary Care Visits ($M) | Attribution Rate due to Drug or Alcohol Abuse | Total Cost of PCP Visits Due to SUD ($M) |
| Office Visit Primary Doctor New Patient High Complexity | $211 | $232 | $143 | $3,933 | 27.9% | $1,097 |
| Office Visit Primary Care Doctor Established Patient Low Complexity | $90 | $49 | ||||
| Medicare/Commercial Weighted | 29% | 71% |
Other Non-Durable Goods
Table 1.9: Total Spend on Non-Durable Goods due to Substance Abuse Disorder
| CMS Projected 2019 Spend ($M) | Attribution % | Total Spend ($M) |
| $69,500 | 1% | $698 |
We used the projected total national expenditure on Non-Durable Goods from CMS’ National Healthcare Expenditure Projections data. We used Lewin’s (2006) methodology and estimated the share of all ambulatory visits attributed to alcohol and applied it to the total projected spend to get the cost due to substance abuse disorder. To calculate the proportion of substance abuse disorder related visits, we used SAMSHA’s Projections for Office Based Professionals and divided by the CMS’ National Projected Health Expenditure for 2020 on Physician and Clinician Services, finding an attribution rate of 1.0%.
Other Health Professionals
Using the May 2018 BLS data for substance abuse disorder related jobs (for non-nurses and physicians), we multiplied the number of substance abuse and mental health counselors and social workers by their annual wage to obtain total cost and then adjusted the number for inflation to arrive at a 2019 estimate.
Table 1.10: Total Cost of Other Health Professionals Related to Substance Abuse Disorder
| Substance Abuse Disorder Related Occupations | # Employed | Annual wage | Total Cost, Inflated to 2019 ($M) | % Attributed to SUD | Total Cost Related to SUD ($M) |
| Substance Abuse, Behavioral Disorder, and Mental Health Counselors | 267,730 | $47,920 | $13,192 | 20.1% | $2,656 |
| Mental Health and Substance Abuse Social Workers | 116,750 | $49,630 | $5,958 | $1,199 | |
| Total | $3,855 |
We calculated the attribution percentage of exclusive substance abuse disorder services using SAMSHA’s National Survey on Drug Use and Health (2018) by summing the number of people that received “mental health services, but not [related to] substance abuse” at a specialty facility to the number of people that received “both substance abuse and mental health services” and then divided by the total number of people that received substance abuse treatment or mental health services.
Specialty Diseases
20 https://www.sciencedirect.com/science/article/pii/S0376871617303277#bib0105
Hepatitis C Treatment
Using the number of estimated acute Hepatitis C cases from previous years, we applied 2016-17 growth rate to estimate the 2019 number of Hepatitis C cases.
We multiplied by the average treatment cost for HCV and divided the number of reported cases to the CDC (2017) that had the potential risk behavior of injection drug use to obtain an attribution for intravenous drug use.
Table 1.11: Total Cost of HCV treatment due to Drug Use
| Number of Acute HCV | Estimated Total HCV treatment cost | Attribution due to Injection Drugs | Total Cost due to Drugs ($M) |
| 54,891 | $95,000 | 33.2% | $1,733 |
Antiretroviral Treatment (ART) for HIV
According to the CDC there were ~1.1M HIV-positive people in the US, of whom 14% do not know they are positive. Approximately thirty-nine thousand were newly diagnosed with HIV in 2017, and ~38k in 2018. We applied a decreasing volume to estimate the number that may receive a diagnosis in 2019.
Table 1.12: Total Number of People with a HIV diagnosis
| Number of HIV Positive in the US (2016, CDC) | # that knows HIV Positive | # of People Receiving New Diagnosis (2017) | # of People Receiving New Diagnosis (2018) | Calculated # of People Receiving New Diagnosis (2019) | Total Number of People with Diagnosis (2019) |
| 1,100,000 | 946,000 | 38,739 | 37,832 | 36,946 | 1,059,517 |
We applied the percentage of those using ART to calculate the number of US ART treatments and multiplied by an average of the whole sale acquisition cost per month and applied the proportion of new HIV diagnoses due to injection drug abuse.21
Table 1.13: Total Cost of Antiretroviral Treatment due to Drug Use
| % of People in North America and Western Europe Accessing ART22 | Number Antiretroviral Treatment (ART) in the US | Wholesale Acquisition Cost (monthly) (2019)23 | Attribution due to Injecting Drugs (2018)24 | Annual Cost due to Drugs ($M) |
| 79.0% | 837,019 | $20,898 | 7% | $1,224 |
Mental Health Treatment for Major Depressive Disorder, Generalized Anxiety Disorder, Post Traumatic Stress Disorder, and Insomnia
Major depressive disorder (MDD), generalized anxiety disorder (GAD), post traumatic stress disorder (PTSD), and chronic insomnia have high rates of comorbidities with each other and substance abuse disorder.
To calculate the MDD costs due to substance abuse we started by using 2019 Census data to get the total US population that is over the age of 18. According to SAMSHA’s 2018 National Survey on Drug Use and Health (NSDUH) 7.2% of adults aged 18 or older had at least one major depressive episode (MDE) in the past year and 64.8% of adults who had a past year MDE received treatment for depression. According to the Anxiety and Depression Association of America, the median age at onset is 32.5 years old. In addition, 177,000 out of 379,000 survey respondents (46.7%) had an MDE and substance use disorder (using illicit drugs or alcohol) resulting in 5.6 M people that had an MDE and substance use disorder and received treatment in the past year.
21 https://www.cdc.gov/hiv/basics/statistics.html
22 https://www.unaids.org/sites/default/files/media_asset/UNAIDS_FactSheet_en.pdf
24 https://www.cdc.gov/hiv/statistics/overview/ataglance.html
Using the same NSDUH data set, we subtracted the number of people that received treatment for mental health and substance abuse disorder at a specialty facility or inpatient setting after allocating the number attributable to MDD, GAD, and PTSD by the percent receiving treatment and percent attributable to substance abuse so that we would not double count with the specialty treatment or inpatient cost calculations from the other sections.
Table 1.14: Number Received Services in a Substance Abuse Treatment Specialty Facility or inpatient Setting
| Number Received Services in a Substance Abuse Specialty Facility or inpatient Setting | |
| Received substance abuse treatment at a specialty facility and mental health services | 645,000 |
| Received mental health services in an inpatient setting | 1,580,000 |
| Major Depressive Disorder (MDD) | 673,347 |
| Generalized Anxiety Disorder (GAD) | 192,240 |
| Post Traumatic Stress Disorder (PTSD) | 516,200 |
A study in the Journal of Clinical Psychiatry (2018) using data from OptumHealth Care solutions (July 2009- March 2015), estimated that 16% of those with major depression had a treatment resistant form of the disorder and do not respond to two or more antidepressants. They estimated that the cost of mental health related care to be $5,325 for treatment resistant depression per person per year and $2,019 for non treatment resistant depression per person per year. Inflating that to 2019 dollars, we were able to calculate the direct mental health-related cost of major depressive disorder to be $14.0 B per year.
Table 1.15: Total Cost of Treatment of Major Depressive Disorder due to Substance Abuse Disorder
| Total Cost of MDD due to Substance Abuse disorder (2019) | ||||
| US population over 18 (2019) | 255,405,918 | |||
| % with MDD | 7.2% | |||
| US population over 18 with MDD | 18,389,226 | |||
| % received treatment | 64.8% | |||
| % attributable to substance abuse disorder | 46.7% | |||
| Population receiving treatment and attributable to substance abuse disorder | 5,565,094 | |||
| Population received mental health and SUD treatment at a specialty facility or inpatient setting | 673,347 | |||
| Population receiving treatment and attributable to substance abuse disorder not in a specialty facility or inpatient setting | 4,891,747 | |||
| % with Treatment Resistant MDD | 16% | % with non Treatment Resistant MDD | 84% | |
| Number of People with Treatment Resistant MDD | 782,680 | Number of People with non Treatment Resistant MDD | 4,109,067 | |
| Direct Costs of Mental Health Treatment Resistant MDD Per Person Per Year | $5,964 | Direct Costs of Mental Health MDD Per Person Per Year | $2,261 | |
| Total cost of MDD attributable to substance abuse disorder ($M) | $13,960 | |||
According to the Anxiety and Depression Association of America 18.1% of adults have anxiety and only 36.9% receive treatment. Generalized Anxiety Disorder affects 3.1% of the US population and yet only 43.2% are receiving treatment. GAD often co-occurs with major depression. For patients with generalized anxiety disorder (GAD), the lifetime prevalence of comorbid alcohol abuse and dependence is 30% to 35%, and the prevalence of drug abuse and dependence is 25% to 30%.25 Approximately 17.7% of respondents with a SUD in the past 12 months also met criteria for an independent (i.e., not attributed to withdrawal or intoxication) anxiety disorder, and 15% of those with any anxiety disorder in the past 12 months had at least one co-occurring SUD.26 Therefore, we used 20% to approximate the cost of generalized anxiety disorder due to substance abuse disorder. We then removed the number that received mental health and substance abuse disorder treatment in a specialty facility or inpatient setting to avoid double counting. A 2005 study using data from MarketScan Databases estimated that GAD was associated with an $2,138 increase in total medical costs
25 https://www.psychiatrictimes.com/anxiety/anxiety-disorders-comorbid-substance-abuse
26 Brady, K. T., Haynes, L. F., Hartwell, K. J., & Killeen, T. K. (2013). Substance use disorders and anxiety: a treatment challenge for social workers. Social work in public health, 28(3-4), 407–423. https://doi.org/10.1080/19371918.2013.774675
(including inpatient, outpatient, and prescription drugs).27 Inflating this to 2019 dollars, we calculated that the total cost of treatment of GAD due to substance abuse disorder is $4.6 B.
Table 1.16: Total Cost of Treatment of Generalized Anxiety Disorder due to Substance Abuse Disorder
| Total Cost of Generalized Anxiety Disorder due to Substance Abuse Disorder (2019) | |
| US population over 18 | 255,405,918 |
| % with Generalized Anxiety Disorder | 3.1% |
| US population over 18 with GAD | 7,917,583 |
| % receive treatment | 43% |
| % attributable to substance abuse disorder | 20% |
| Number of adults attributable to substance abuse and received treatment | 1,583,517 |
| Received treatment in specialty facility or inpatient setting | 192,240 |
| Population receiving treatment and attributable to substance abuse disorder not in a specialty facility or inpatient setting | 1,391,277 |
| Cost of treatment | $3,293 |
| Total cost of GAD due to substance abuse disorder ($M) | $4,581 |
According to the Anxiety and Depression Association of America, 3.5% of the US adult population has PTSD. The VA indicated that 7-8% of the population will have PTSD at some point in their lives. Since 50% of those with PTSD will never reach out for professional help, we assume 50% will receive treatment.28 A 2010 study using the Wave 2 National Epidemiologic Survey on Alcohol and Related Conditions data showed that 46.4% of full PTSD respondents also met the criteria for any alcohol or drug use disorder. In one study of veterans, 63% of those who met the diagnostic criteria for alcohol use disorders (AUDs) or drug use disorders had co- occurring PTSD, while the PTSD prevalence among those who met criteria for both AUDs and drug use disorders (e.g., alcohol dependence and cocaine abuse) was 76%. Estimates for the average cost of PTSD per patient ranged from $4,520 (Department of Defense, 2012) to $8,300 (Congressional Budget Office, 2009). The average cost per patient for PTSD specific care only was $4,100 for the first year and then went down after that. We inflated the figure to 2019 numbers to get a total of $8.0 B for the cost of PTSD treatment due to substance abuse disorder.
Table 1.17: Total Cost of Treatment of PTSD due to Substance Abuse Disorder
| Total Cost of PTSD due to Substance Abuse Disorder (2019) | |
| US Population over 18 | 255,405,918 |
| % with PTSD | 3.5% |
| US Population over 18 with PTSD | 8,939,207 |
| % received treatment | 50% |
| % attributable to substance abuse disorder | 46% |
| Number of adults attributable to substance abuse and received treatment | 2,073,896 |
| Received treatment in inpatient setting or specialty treatment facility | 516,200 |
| Population receiving treatment and attributable to substance abuse disorder not in a specialty facility or inpatient setting | 1,557,696 |
| Cost of treatment | $5,125 |
| Total cost of PTSD treatment attributable to substance abuse disorder ($M) | $7,983 |
According to the American Academy of Sleep Medicine, about 30% of adults have symptoms of insomnia, 10% have insomnia that is severe enough to cause daytime consequences, and less than 10% of adults are likely to have chronic insomnia. Approximately 3% of the population has insomnia symptoms that are caused by a medical or psychiatric condition (including drug or substance, medical condition, or mental disorder). The Addiction Center states that according to the CDC, about half the people that suffer from sleep disorders regularly abuse alcohol and/or narcotic drugs do so in order to enhance sleep. Another study showed that 28% of insomniacs reporting using alcohol to help them sleep. There is a risk of abuse and dependence of benzodiazepines and nonbenzodiazepines especially with patients with anxiety disorder and a history of alcohol or drug abuse. Ramelteon, low-dose sinequan, and cognitive behavioral therapy (CBT-I) are alternative treatments that have minimal adverse effects and no risk of abuse.29 The cost of treatment was estimated by
27 Marciniak, Martin & Lage, Maureen & Dunayevich, Eduardo & Russell, James & Bowman, Lee & Landbloom, Ronald & Levine, Louise. (2005). The cost of treating anxiety: The medical and demographic correlates that impact total medical costs. Depression and anxiety. 21. 178-84. 10.1002/da.20074.
28 http://www.ptsdalliance.org/about-ptsd/
29 https://www.psychiatrictimes.com/sleep-disorders/treatment-insomnia-anxiety-disorders
using the mean of one study’s estimated Medicare cost for therapy (2016) which was $449 and the cost from a 2011 post from the American Academy of Sleep Medicine indicating that the average cost of treating insomnia ranges from about $200 a year for a generic sleeping pill to up to $1,200 for behavioral therapy. The total cost of treatment of insomnia due to substance abuse disorder was $3.7 B.
Table 1.18: Total Cost of Treatment of Insomnia due to Substance Abuse Disorder
| Total Cost of Insomnia due to Substance Abuse Disorder (2019) | |
| US Population over 18 | 255,405,918 |
| % with insomnia symptoms due to medical or psychiatric condition | 3% |
| US Population over 18 with insomnia | 7,662,178 |
| % attributable to substance abuse disorder | 50% |
| Number of adults attributable to substance abuse and received treatment | 3,831,089 |
| Cost of treatment | $974 |
| Total cost of insomnia treatment attributable to substance abuse disorder ($M) | $3,733 |
As stated earlier, major depressive disorder, general anxiety disorder, PTSD, and insomnia are highly comorbid with each other and substance abuse. For example, nearly 50% of all people diagnosed with depression are also diagnosed with anxiety disorder. One more recent Medical University of Vienna study indicated a 10.8% comorbid prevalence30.
Nearly 70-87% of individuals with PTSD experience insomnia. It is estimated that up to 80% of PTSD patients have a comorbid disorder, with the most common comorbidities being depression, anxiety, alcohol addiction, and substance abuse.31 “Difficulty sleeping” was reported by up to 90% of individuals with PTSD application of DSM-5 criteria for insomnia suggest a range of 35–61%.32
To help adjust for double counting, we added the cost of MDD and GAD and reduced it by 20% and added the cost of PTSD and insomnia and reduced it by 60%. Therefore, the total cost of treatment of mental health due to substance abuse disorder is $19.5 B.
Table 1.19: Total Cost of Treatment of Mental Health due to Substance Abuse Disorder
| Total Cost of Treatment of Mental Health due to Substance Abuse Disorder (2019) | ||||
| MDD | GAD | PTSD | Insomnia | |
| Total cost ($M) | $13,960 | $4,581 | $7,983 | $3,733 |
| Double counting adjustment | 20% | 60% | ||
| Total cost of treatment of mental health ($M) | $19,519 |
Hypertension
The cost for treatment of hypertension due to substance abuse disorder was calculated using the US Census population for adults over 20 years old. The CDC showed that around 30-31% percent of the US population over 20 years old has hypertension since about 2000-2016. The US Department of Health and Human Services used the National Health and Nutrition Examination Survey from 2013-2016 to show that 81% of those with hypertension were recommended to implement life style modifications plus medication and not just life style modifications. A 2004 article published in Hypertension, stated that even low estimates of 5% or 7% of HTN attributable to alcohol imply that there are more patients with HTN caused by alcohol than by conventional causes of remediable secondary HTN. Another article published in 2013 in the Journal of Clinical Hypertension, stated that 16% of hypertensive disease is attributable to alcohol consumption. The rate of hypertension due to drug abuse was not considered for this analysis since it is generally more acute episodes and likely capture in the inpatient or outpatient emergency visit calculations. The 2018 study “Trends in Healthcare Expenditures Among US Adults with Hypertension: National Estimates, 2003–2014” uses the Medical Expenditure Panel Survey, to calculate the estimated annual healthcare expenditure for patients with hypertension and to measure trends in expenditure longitudinally over a 12‐year period. The incremental cost associated with hypertension was $2,000 and remained steady from 2003-2014, therefore we just inflated the cost to 2019.
30 https://www.ecnp.eu/presentationpdfs/71/P.2.b.026.pdf
31 https://www.pharmaceutical-technology.com/comment/ptsd-and-comorbidity/
32 Colvonen, P.J., Straus, L.D., Stepnowsky, C. et al. Recent Advancements in Treating Sleep Disorders in Co-Occurring PTSD. Curr Psychiatry Rep 20, 48 (2018). https://doi.org/10.1007/s11920-018-0916-9
Table 1.20: Total Cost of Treatment of Hypertension due to Substance Abuse Disorder
| Total Cost of Hypertension due to Substance Abuse Disorder (2019) | |
| US Population over 20 | 246,749,764 |
| % of US age 20+ with hypertension | 31% |
| US Population over 18 with hypertension | 75,266,795 |
| Recommended intervention type: life style modification plus medication | 81% |
| % attributable to alcohol | 5% |
| Cost per person | $2,300 |
| Cost of hypertension treatment due to substance abuse ($M) | $7,011 |
Specialty SUD Treatment
Community Based Specialty Treatment
Table 1.21: Total Cost of Community Based Specialty Treatment due to Substance Abuse Disorder
| # of Treatments by Type of Service (2018) | Average Length of Stay | Average Cost Per Day | Total Cost ($M) | |
| outpatient | 1,799,410 | 78.0 | $91 | $12,707 |
| Intensive outpatient | 622,940 | 42.0 | $300 | $7,849 |
| Short-term residential | 435,889 | 20.0 | $650 | $5,667 |
| Long-term residential | 399,636 | 39.0 | $650 | $10,131 |
| Hospital residential | 11,119 | 22.0 | $650 | $159 |
| outpatient med assisted therapy (outpatient and intensive outpatient medication assisted opioid therapy was planned) | 405,334 | 90.0 | $13 | $470 |
| detoxification | 922,672 | 4.1 | $667 | $295 |
| Total | 4,597,00033 | $38,975 |
We did not use the National Survey of Substance Abuse Treatment Service (N-SSATS) to determine the number of facilities by type in the US in 2018 because it no longer provides the median population by facility type.
Instead, we used the total number of people that received treatment in specialty facilities (4,597,000) in 2018 from NSUDH at each type of location because respondents could indicate multiple locations of treatment in that survey, so it was a better proxy of total number of treatments.
We applied the percent of each treatment type from the TEDS 2017 discharges distribution34 to get the breakdown of the total number of treatments at specialty facilities by type of treatment service. We found the average length of stay and calculated average costs of per day using a variety of sources. We made sure to check that the value used was in within range or lower than multiple sources to make sure that we were still conservative in our estimates.
- outpatient: The average cost per day was from a Marwood analysis conducted in 2014 where we applied the historical 2% CAGR from the same report.
- Intensive outpatient: We used the average of the range provided by the American Addiction Centers.
- Short term and long term residential: We used the average of the range provided by the American Addiction Centers for 28 and 30 day drug and alcohol rehab and then estimated the cost per day.
- Hospital residential: We used the American Addiction Centers value for inpatient residential and selected the high end of the range given the higher estimates from other sources, including the 2014 Marwood analysis.
- outpatient med assisted therapy: This estimate was from the Addiction Center based on a one year long methadone treatment was $4,700.
33 NSDUH (2018), Table 5.27A Locations Received Substance Use Treatment in Past Year among Persons Aged 12 or Older Who Received Substance Use Treatment at a Specialty Facility in Past Year, by Age Group
34 TEDS (2017), Table 5.1. Discharges aged 12 years and older, by reason for discharge and type of treatment service: Number, median
length of stay (LOS)
- detoxification: Sources did not specify the detoxification costs broken down into detoxification and medication assisted opioid detoxification (methadone, buprenorphine, naltrexone). Therefore, we used a blended rate in the range of the detoxification costs.
We then multiplied the number of people that received treatment at specialty facilities by the average length of stay and average cost per day to get the total community-based specialty treatment costs due to substance abuse disorder.
The total cost was $39.0 B and the average cost per specialty community-based treatment was $8,478
Federal Specialty Treatment Spending
The FY 2019 Budget and Performance Summary from the Office of National Drug Control Policy outlines the Federal Drug Control Funding by functional area. The funding for treatment allocated is $7,167 M.
Treatment are activities conducted to assist users with their substance abuse and related health problems and include:
- Screening for controlled substances
- Interventions for drug use and SUDs
- Rehabilitation and recovery support
- Medical referral
- Drug courts and other community corrections programs that utilize drug testing and swift and certain sanctions to deter future drug use and treat chronic reoccurrence of drug use and SUDs
- Relapse prevention
- Re-entry support for ex-offenders that includes, but is not limited to housing, education, employment and substance and mental health (MH) abuse treatment
- International health care, research, rehabilitation, and interventions for SUD
- All other service programs intended to ease the health-related consequences of drug use and SUDs Table 1.22: FY 2019 Federal Drug Control Funding for Treatment
| Department | Division | 2019 Spend ($M)* |
| Department of Agriculture | Office of Rural Development | $25 |
| DC Court Services and Offender Supervision Agency | All | $31 |
| Department of Defense | Defense Health Program | $101 |
| Federal Judiciary | All | $162 |
| Department of Health and Human Services | Centers for Medicare & Medicaid Services35 | |
| Department of Health and Human Services | Health Resources and Services Administration | $553 |
| Department of Health and Human Services | National Institute of Health | $876 |
| Department of Health and Human Services | Indian Health Service | $90 |
| Department of Health and Human Services | Substance Abuse and Mental Health Services Administration | $3,540 |
| Department of Housing and Urban Development | Office of Community Planning and Development | $555 |
| Department of Justice | Bureau of Prisons | $118 |
| Department of Justice | Drug Enforcement Administration | $0 |
| Department of Justice | Office of Justice Programs | $313 |
| Office of National Drug Control Policy | High Intensity Drug Trafficking Areas | $4 |
| Office of National Drug Control Policy | Other Federal Drug Control Programs | $2 |
| Office of National Drug Control Policy | Salaries and Expenses | $3 |
| Department of Transportation | National Highway Traffic Safety Administration | $1 |
| Department of Veterans Affairs | Veteran’s Health Administration | $794 |
| Total Spend on Treatment | $7,167 |
*”Research and Development: Treatment” was included, but “Research and Development: Prevention” was classified in “Prevention”
35 Removed for double counting. The estimates for the Centers for Medicare & Medicaid Services reflect Medicaid and Medicare benefit outlays for substance abuse treatment; they do not reflect budget authority so removed due to double counting
Health Insurance Administration
Table 1.23: Total Cost of Health Insurance Administration due to Substance Abuse Disorder
| Category | |
| Total Medical Services Cost ($M) | $53,276 |
| Overhead premium adjustment | 6% |
| Cost of Health Insurance ($M) | $3,197 |
Insurance administration costs are not included in the costs of care identified above, and they typically amount on average to 6% overhead on medical services, according to NDIC (2011). We applied this factor to the total cost of inpatient and ED visits due to substance abuse disorders, a conservative approach since we did not include other settings or types of medical services.
Crime Victim Health Care Costs
Table 1.24: Total Medical Costs of Crime Victims due to Substance Abuse Disorder
| Category | Violent Crime | Property Crime |
| # of events | 6,385,520 | 13,502,840 |
| Medical Costs Per Event | $48 | $0 |
| Total Medical Costs ($M) | $308 | $0 |
| Attribution | 12% | 31% |
| Total Medical Costs due to Drugs ($M) | $37 | $0 |
The number of violent crimes and property crimes were obtained from the Crime Victimization report (2018) from the US Bureau of Justice Statistics, and the estimated associated medical cost per event was adjusted from the figures in the 2011 NDIC report.
II. INDIRECT TANGIBLE COSTS
Productivity Loss
Summary
The indirect productivity loss costs associated with substance abuse disorders total $206.8 B annually, mainly driven by premature death. Incarceration and absenteeism, followed by the costs of diminished productivity and victims of crime, are also contributing factors.
[img 4.0]
| Categories | Cost ($M) | Adjustment for Double Counting | % |
| Productivity Loss due to Health | $210,225 | $183,963 | 89.0% |
| Premature death (Mortality) | $179,186 | $156,801 | 75.8% |
| Morbidity – Absenteeism | $17,124 | $14,984 | 7.2% |
| SUD treatment -Institutionalization/Hospitalization | $16,865 | $14,758 | 7.1% |
| Medical conditions- Institutionalization/Hospitalization | $258 | $226 | 0.1% |
| Morbidity – Diminished productivity | $13,916 | $12,178 | 5.9% |
| Productivity Loss due to Crime | $26,043 | $22,789 | 11.0% |
| Incarceration | $26,042 | $22,789 | 11.0% |
| Victims of Crime | $0.3 | $0.3 | 0.0% |
| Total | $236,268 | $206,753 | 100.0% |
Methodology and Analysis
We replicated Grosse’s 2009 methodology to calculate market and household productivity by age and sex.36
Table 2.1: Daily Production of the US Noninstitutional Population (2019)
| Average Daily Hours Working at a Job (2018)37 | Usual Hourly Compensatio n (2019)38 | Daily Market Compensation | Average Daily Hours of Household Service (2018) | Household Service Daily Value | Daily Production (hours) | Daily Production Value | |
| Males | |||||||
| 15 to 19 years | 1.24 | $16.38 | $20.31 | 0.73 | $11.64 | 1.97 | $31.96 |
| 20 to 24 years | 3.75 | $20.27 | $76.02 | 0.69 | $11.01 | 4.44 | $87.02 |
| 25 to 34 years | 5.88 | $29.08 | $170.98 | 1.07 | $17.07 | 6.95 | $188.05 |
| 35 to 44 years | 6.05 | $37.19 | $225.00 | 1.28 | $20.42 | 7.33 | $245.42 |
| 45 to 54 years | 5.67 | $37.89 | $214.85 | 1.34 | $21.37 | 7.01 | $236.22 |
| 55 to 64 years | 4.18 | $37.87 | $158.31 | 1.78 | $28.39 | 5.96 | $186.70 |
| 65 to 74 years | 1.29 | $34.35 | $44.31 | 2.03 | $32.38 | 3.32 | $76.70 |
| 75 years and over | 0.71 | $34.35 | $24.39 | 1.89 | $30.15 | 2.60 | $54.54 |
| Females | |||||||
| 15 to 19 years | 1.2 | $13.95 | $16.74 | 0.94 | $14.99 | 2.14 | $31.74 |
| 20 to 24 years | 3.29 | $18.20 | $59.87 | 1.56 | $24.88 | 4.85 | $84.76 |
| 25 to 34 years | 4.16 | $25.58 | $106.43 | 1.99 | $31.74 | 6.15 | $138.17 |
36 Med Care 2009;47: S94–S103
37 https://www.bls.gov/charts/american-time-use/activity-by-agem.htm
38 https://www.bls.gov/bls/news-release/wkyeng.htm#2019
| 35 to 44 years | 4.15 | $29.79 | $123.64 | 2.3 | $36.69 | 6.45 | $160.33 |
| 45 to 54 years | 4.22 | $29.29 | $123.59 | 2.31 | $36.85 | 6.53 | $160.43 |
| 55 to 64 years | 3.43 | $28.58 | $98.04 | 2.4 | $38.28 | 5.83 | $136.33 |
| 65 to 74 years | 0.85 | $27.19 | $23.12 | 2.82 | $44.98 | 3.67 | $68.10 |
| 75 years and over | 0 | $27.19 | $0.00 | 2.32 | $37.01 | 2.32 | $37.01 |
| All | |||||||
| 15 to 19 years | 1.22 | $15.41 | $18.80 | 0.84 | $13.40 | 2.06 | $32.20 |
| 20 to 24 years | 3.52 | $19.37 | $68.18 | 1.12 | $17.87 | 4.64 | $86.04 |
| 25 to 34 years | 5.01 | $27.43 | $137.42 | 1.53 | $24.41 | 6.54 | $161.82 |
| 35 to 44 years | 5.08 | $33.53 | $170.35 | 1.8 | $28.71 | 6.88 | $199.06 |
| 45 to 54 years | 4.93 | $33.54 | $165.35 | 1.83 | $29.19 | 6.76 | $194.54 |
| 55 to 64 years | 3.79 | $33.04 | $125.22 | 2.1 | $33.50 | 5.89 | $158.72 |
| 65 to 74 years | 1.05 | $30.42 | $31.94 | 2.45 | $39.08 | 3.50 | $71.02 |
| 75 years and over | 0.49 | $30.42 | $14.90 | 2.14 | $34.14 | 2.63 | $49.04 |
Daily Market Compensation: We used the Bureau of Labor Statistic’s American Time Use 2018 survey (BLS ATUS) to obtain the average hours per day spent on “working and work-related activities” and “household activities” for civilian noninstitutional populations by sex and age category. We obtained the compensation data from BLS’s Usual Weekly Earnings of Full-Time Wage and Salary Workers and averaged the 4 quarters from 2019 since the data was not seasonally adjusted and calculated the hourly rate. If the age categories did not match up, we rolled up the cost categories or applied the rate if it was within range of the category.
Household Service Daily Value: To calculate the household service daily value, we used the average hours per day spent on “household activities” from BLS. We calculated a mean hourly salary of $14.81 ($15.95 including an estimate for legally required benefits from the Employer Costs for Employee Compensation December 2019 report) to quantify the value of household activities by averaging the mean hourly wages of various paid occupations in the Occupational Employment and Wages (May 2019) database that had similar activities such as childcare worker, janitors, maids and housekeeping, passenger vehicle drivers, food preparation, landscaping, etc.
As noted in Grosse’s 2009 report, we could have added additional activities to measure economic productivity than just “working and work-related activities” and “household activities” such as “caring for and helping household and non-household members”, “purchasing goods and services”, “educational activities”, etc., but chose to take the more conservative approach given the argument that people with substance abuser disorders may be less economically productive than the average population.
Table 2.2: Daily Production of the US Total Population (2018/2019)
| (Thousands) | Civilian Noninstitution al Population (2018) | Total Population (2018) | Total Group Quarters (2018) | US Military Group Quarters Population (2018) | US Nonmilitary Group Quarters Population (2018) | Per Person Annual Market Compensat ion of US Population | Per Person Annual Household Production Value of US Population | Per Person Annual Production Value of US Population |
| Males | 161,118,151 | 160,966,380 | 4,927,790 | 303,828 | 3,880,091 | $7,314 | $4,117 | $11,431 |
| 15 to 24 years | 22,094,421 | 21,247,562 | 2,123,877 | 251,569 | 1,534,227 | $26,294 | $3,627 | $29,922 |
| 25 to 34 years | 22,980,929 | 22,374,327 | 625,829 | 45,270 | 675,496 | $60,672 | $6,053 | $66,725 |
| 35 to 44 years | 20,691,045 | 20,442,730 | 473,068 | 5,469 | 533,773 | $80,068 | $7,284 | $87,352 |
| 45 to 54 years | 20,520,290 | 20,442,730 | 384,368 | 911 | 358,866 | $77,073 | $7,658 | $84,731 |
| 55 to 64 years | 20,395,960 | 20,764,663 | 349,873 | 304 | 237,849 | $57,117 | $10,189 | $67,305 |
| 65 to 74 years | 14,277,428 | 14,969,873 | 271,028 | – | 153,540 | $16,003 | $11,599 | $27,602 |
| 75 years and over | 9,013,470 | 10,784,747 | 650,468 | – | 357,359 | $8,563 | $10,263 | $18,826 |
| Females | 166,049,288 | 166,201,059 | 3,163,819 | 51,942 | 2,637,439 | $6,026 | $5,369 | $11,395 |
| 15 to 24 years | 21,069,034 | 21,938,540 | 1,363,606 | 43,008 | 1,495,437 | $20,468 | $8,514 | $28,982 |
| 25 to 34 years | 22,363,745 | 23,101,947 | 401,805 | 7,739 | 103,821 | $38,679 | $11,378 | $50,057 |
| 35 to 44 years | 20,807,408 | 21,107,534 | 303,727 | 935 | 67,197 | $44,985 | $13,198 | $58,183 |
| 45 to 54 years | 21,084,954 | 21,107,534 | 246,778 | 156 | 72,408 | $44,955 | $13,294 | $58,249 |
| 55 to 64 years | 21,891,402 | 21,439,937 | 224,631 | 52 | 123,845 | $35,585 | $13,831 | $49,417 |
| 65 to 74 years | 16,293,885 | 15,456,698 | 174,010 | – | 186,426 | $8,342 | $16,245 | $24,587 |
| 75 years and over | 12,838,331 | 11,135,471 | 417,624 | – | 578,307 | $0 | $13,082 | $13,082 |
| All | 327,167,439 | 327,167,439 | 8,091,609 | 355,770 | $6,905 | $4,768 | $11,672 | |
| 15 to 24 years | 43,163,455 | 43,186,102 | 3,487,483 | 294,578 | $25,099 | $5,996 | $31,094 | |
| 25 to 34 years | 45,344,674 | 45,476,274 | 1,027,634 | 53,010 | $50,192 | $8,701 | $58,893 | |
| 35 to 44 years | 41,498,453 | 41,550,265 | 776,794 | 6,404 | $62,184 | $10,286 | $72,470 | |
| 45 to 54 years | 41,605,244 | 41,550,265 | 631,146 | 1,067 | $60,355 | $10,495 | $70,850 | |
| 55 to 64 years | 42,287,362 | 42,204,600 | 574,504 | 356 | $45,706 | $12,063 | $57,769 | |
| 65 to 74 years | 30,571,313 | 30,426,572 | 445,038 | – | $11,657 | $14,060 | $25,717 | |
| 75 years and over | 15,547,953 | 21,920,218 | 1,068,092 | – | $0 | $11,659 | $11,659 |
Per Person Annual Production Value of the US Population: In order to adjust for the total population, we used the US BLS American Community Survey (2018) to obtain the estimated population of noninstitutionalized civilians and the rest of the population that are in Group Quarters. Again, following the rationale in Grosse’s 2009 report, we assumed that the population in juvenile facilities, adult correctional facilities, nursing facilities, and college/nursing were productive, but the costs of supervision and care may eliminate most of the benefits, so we excluded them in our productivity calculations. We also included the military population to add to the market compensation of the US population but did not add them to the household production value.
Using the same ATUS and BLS data as in Table 2.2, we were able to calculate the Per Person Annual Production value of the US Population.
Table 2.3 Present Value of Lifetime Production and Market Production of the US Total Population, by Discount Rate, Gender, and Age (2018/2019)
| Age Group | Market Productivity (3%) | Total Productivity (3%) |
| <1 year< td> | $1,096,783 | $1,350,379 |
| 1-4 years | $1,159,573 | $1,427,688 |
| 5-14 years | $1,338,945 | $1,648,534 |
| 15-24 years | $1,482,287 | $1,823,847 |
| 25-34 years | $1,392,781 | $1,730,187 |
| 35-44 years | $1,094,684 | $1,406,132 |
| 45-54 years | $688,984 | $962,943 |
| 55-64 years | $297,675 | $523,345 |
| 65-74 years | $92,429 | $249,760 |
| 75-84 years | $42,646 | $134,045 |
| 85+ years | $20,938 | $65,811 |
Present Value of Lifetime Production and Market Production of the US Total Population: We utilized the Present Value of Lifetime Earnings (PVLE) formula found in the Max 2004 report.
100
L = ∑ ( ) ∗ ( ) ∗ (1 + ) − /(1 + ) −
=
L – the present discounted value of lifetime earnings for a person of age y
y – the age of the person at present
n – the age of the person
Py(n) – the probability that the person of age y will survive to age n
E(n) – the mean annual earnings or production value
p – the rate of increase of labor productivity
r – the discount rate
Using the annual market and total production value [E(n)] calculated in Table 2.3 and the probability of survival [Py(n)] from CDC’s Life Table (2017), we were able to estimate the present value of the lifetime production and market production. Using Grosse’s (2009) guidance, we applied a 1% productivity increase assumption year over year and then applied a 3% discount to obtain the present value. To obtain the values for each age bracket, we took the average PVLE of the endpoints and the middle age (Ex. the average PVLE for ages 5-14 was based on the PVLE of age 5, 10, and 14)
Productivity Loss due to Poor Health from Substance Abuse Disorder
Table 2.4 Premature Death (Mortality) in $ M
| Premature death (Mortality) Year (2018) | Total Productivity | Loss to Society (using Total Value) | |||||
| Drugs | Alcohol | Total | 3% | Drugs | Alcohol | Total | |
| <1 year< td> | 41 | 2 | 42 | $1.4 | $54.7 | $2.0 | $56.7 |
| 1-4 years | 40 | – | 40 | $1.4 | $56.4 | $0.0 | $56.4 |
| 5-14 years | 60 | 3 | 63 | $1.6 | $98.9 | $4.9 | $103.9 |
| 15-24 years | 5,011 | 537 | 5,548 | $1.8 | $9,139.3 | $979.4 | $10,118.7 |
| 25-34 years | 17,995 | 3,293 | 21,287 | $1.7 | $31,133.8 | $5,696.6 | $36,830.5 |
| 35-44 years | 19,427 | 6,333 | 25,760 | $1.4 | $27,316.9 | $8,904.3 | $36,221.3 |
| 45-54 years | 26,237 | 12,744 | 38,981 | $1.0 | $25,264.3 | $12,271.7 | $37,536.0 |
| 55-64 years | 46,820 | 19,193 | 66,013 | $0.5 | $24,503.0 | $10,044.6 | $34,547.6 |
| 65-74 years | 51,239 | 10,257 | 61,495 | $0.2 | $12,797.3 | $2,561.7 | $15,359.0 |
| 75-84 years | 45,634 | 3,060 | 48,694 | $0.1 | $6,116.9 | $410.2 | $6,527.1 |
| 85+ years | 27,103 | 683 | 27,786 | $0.1 | $1,783.7 | $44.9 | $1,828.6 |
| Not Stated | 22 | 6 | 28 | $1.4 | $0 | $0 | $0 |
| Total | 239,626 | 56,109 | 295,735 | $138,265.3 | $40,920.4 | $179,185.7 |
Premature Death (Mortality): To calculate the cost of premature mortality due to substance abuse disorders, we pulled the total of deaths from the CDC Wonder data (2018) where alcohol or drugs were the underlying cause of death (UCD) or were among the multiple causes of death (MCD). We averaged the UCD and MCD total deaths due to drugs and the UCD and MCD total deaths due to alcohol and used our estimated lifetime productivity loss to calculate the loss to society due to the premature deaths. This value assumes that if the person did not die due to substance abuse disorders at that age, the individual would have lived a productive life until the average expected age.
Morbidity – Absenteeism (Institutionalization/Hospitalization)
Table 2.5: Productivity Loss Due To Substance Abuse Disorder Treatment
| % of Admissions | TEDS-A Admissions Per Day | TEDS-A LOS | Days In Care | Daily Production Value | Loss of Productivity due to Treatment ($M) | ||
| Male | |||||||
| 12-17 years | 2.4% | 48980 | 50.2 | 2,457,759 | 15 to 19 years | $32 | $78.5 |
| 18-20 years | 2.3% | 45360 | 50.2 | 2,276,075 | 15 to 19 years | $32 | $72.7 |
| 21 to 24 years | 6.0% | 120598 | 50.2 | 6,051,403 | 20 to 24 years | $87 | $526.6 |
| 25 to 29 years | 11.6% | 233251 | 50.2 | 11,704,171 | 25 to 34 years | $188 | $2,200.9 |
| 30 to 34 years | 10.7% | 214238 | 50.2 | 10,750,130 | 25 to 34 years | $188 | $2,021.5 |
| 35 to 39 years | 8.5% | 171236 | 50.2 | 8,592,351 | 35 to 44 years | $245 | $2,108.7 |
| 40 to 44 years | 5.7% | 114482 | 50.2 | 5,744,499 | 35 to 44 years | $245 | $1,409.8 |
| 45 to 49 years | 5.7% | 114192 | 50.2 | 5,729,971 | 45 to 54 years | $236 | $1,353.5 |
| 50 to 54 years | 5.3% | 105618 | 50.2 | 5,299,722 | 45 to 54 years | $236 | $1,251.9 |
| 55 to 59 years | 3.7% | 75165 | 50.2 | 3,771,672 | 55 to 64 years | $187 | $704.2 |
| 60 to 64 years | 1.7% | 34417 | 50.2 | 1,726,980 | 55 to 64 years | $187 | $322.4 |
| 65 to 69 years | 0.6% | 11067 | 50.2 | 555,340 | 65 to 74 years | $77 | $42.6 |
| 70 to 74 years | 0.2% | 3104 | 50.2 | 155,733 | 65 to 74 years | $77 | $11.9 |
| 75 years and older | 0.1% | 1442 | 50.2 | 72,382 | 75 years and over | $55 | $3.9 |
| Subtotal | $12,109.4 | ||||||
| Female | |||||||
| 12-17 years | 1.3% | 26978 | 50.2 | 1,353,688 | 15 to 19 years | $32 | $43.0 |
| 18-20 years | 1.2% | 24983 | 50.2 | 1,253,620 | 15 to 19 years | $32 | $39.8 |
| 21 to 24 years | 3.3% | 66423 | 50.2 | 3,333,000 | 20 to 24 years | $85 | $282.5 |
| 25 to 29 years | 6.4% | 128471 | 50.2 | 6,446,438 | 25 to 34 years | $138 | $890.7 |
| 30 to 34 years | 5.9% | 117999 | 50.2 | 5,920,971 | 25 to 34 years | $138 | $818.1 |
| 35 to 39 years | 4.7% | 94314 | 50.2 | 4,732,507 | 35 to 44 years | $160 | $758.7 |
| 40 to 44 years | 3.1% | 63054 | 50.2 | 3,163,963 | 35 to 44 years | $160 | $507.3 |
| 45 to 49 years | 3.1% | 62895 | 50.2 | 3,155,961 | 45 to 54 years | $160 | $506.3 |
| 50 to 54 years | 2.9% | 58172 | 50.2 | 2,918,988 | 45 to 54 years | $160 | $468.3 |
| 55 to 59 years | 2.1% | 41400 | 50.2 | 2,077,366 | 55 to 64 years | $136 | $283.2 |
| 60 to 64 years | 0.9% | 18956 | 50.2 | 951,188 | 55 to 64 years | $136 | $129.7 |
| 65 to 69 years | 0.3% | 6096 | 50.2 | 305,871 | 65 to 74 years | $68 | $20.8 |
| 70 to 74 years | 0.1% | 1709 | 50.2 | 85,775 | 65 to 74 years | $68 | $5.8 |
| 75 years and older | 0.0% | 795 | 50.2 | 39,867 | 75 years and over | $37 | $1.5 |
| Subtotal | $4,755.7 | ||||||
| TOTAL | $16,865.2 |
Loss of Productivity due to Treatment: We used the Treatment Episode Data Set: Admissions (TEDS-A-2017) and TEDS- Discharges (2017) because they have the national annual admissions to and discharges from substance abuse disorder treatment facilities. Using the information from TEDS-A, we were able to break down the admissions by age and sex. From there, we applied the median length of stay from the TEDS-D data set to obtain the number of days per age and sex. We were then able to use the Daily Production Value from Table 2.2 to calculate the loss of productivity due to substance abuse disorder treatment.
Table 2.6: Productivity Loss Due To Hospitalization Of Substance Abuse Disorder Related Medical Conditions
| Primary Diagnosis | # of Total IP Visits (2017) | Average LOS IP Visits | Days Missed | Daily Production Value (2019) | Total Productivity Lost ($M) |
| Alcohol related disorders | 305,585 | 4.6 | 1,400,274 | $119 | $166.7 |
| Opioid Related Disorders | 85,370 | 4.7 | 401,455 | $119 | $47.8 |
| Cannabis Related Disorders | 7,340 | 6.0 | 43,835 | $119 | $5.2 |
| Sedative, Hypnotic, or Anxiolytic Related Disorders | 11,830 | 4.7 | 55,750 | $119 | $6.6 |
| Cocaine Related Disorders | 11,740 | 6.1 | 71,970 | $119 | $8.6 |
| Other Stimulant Related Disorders | 20,580 | 4.6 | 95,425 | $119 | $11.4 |
| Hallucinogen Related Disorders | 1,370 | 4.7 | 6,455 | $119 | $0.8 |
| Nicotine Dependence | 610 | 3.1 | 1,915 | $119 | $0.2 |
| Inhalant Related Disorders | 120 | 6.8 | 820 | $119 | $0.1 |
| Other Psychoactive Substance Related Disorders | 20,605 | 4.5 | 93,080 | $119 | $11.1 |
| Total | $258.5 |
Using the National inpatient Sample (NIS, 2017) data, we pulled the encounters that had a primary diagnosis of substance abuse disorders by ICD-10 codes and the average length of visit to calculate the number of days missed due to hospitalization. We then used the average of the overall Daily Production Value calculated in Table 2.2 to estimate the total productivity lost due to hospitalizations from substance abuse disorders.
Table 2.7 Morbidity (Diminished Productivity)
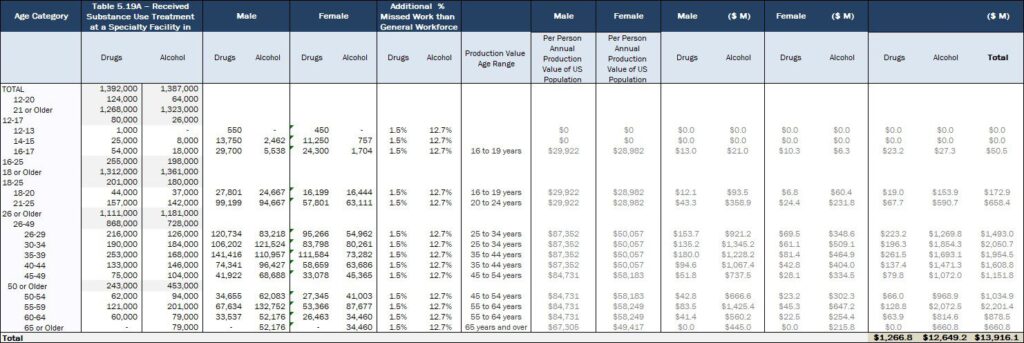
Diminished Productivity due to Morbidity: We used SAMHSA’s 2018 National Survey on Drug Use and Health to identify the breakdown of people that “Received Substance Abuse Treatment at A Specialty Facility In The Past Year Among Persons Aged 12 Or Older.” Due to the difference between the male and female Annual Production Value of the US Population (Table 2.3), we applied the sex breakdown by illicit drug or alcohol abuse to obtain an estimate of the number of people by gender, and then applied an attribution factor to indicate diminished productivity due to substance abuse disorders. A 2017 Journal of Occupational and Environmental Medicine article used data from the 2008-2012 National Survey on Drug and Health to estimate how many more days workers that abused substances or used alcohol, illicit drugs, pain med, and marijuana missed work due to illness and injury or did not work for reasons other than planned vacation or days missed for illness, injury or care for a sick child or other family member. (This study did not account for sick leave or PTO benefits, but costs were included since these also inconvenience employers and reduce measured productivity). Notably, the CDC has indicated that enterprises sometimes assess sick day use as the most direct measure to determine whether health programs are increasing worker productivity.39
Table 2.8: Attribution Factor for Diminished Productivity
| General Work Force | Any SUD | Alcohol Use Disorder | Illicit Drug Use Disorder | Pain Med Use Disorder | Marijuana Use Disorder | In Recovery | |
| Missed workdays for injury, illness past year | 8.4 | 10.2 | 9.4 | 13.0 | 22.2 | 10.6 | 8.3 |
| Missed workdays for other reasons past year | 2.1 | 4.7 | 4.7 | 5.4 | 6.8 | 4.8 | 1.2 |
| Total missed workdays past year | 10.5 | 14.8 | 14.1 | 18.4 | 29.0 | 15.4 | 9.5 |
| Estimated working days (using BLS’s 2019 consolidated leave average estimate of 14 days) | 247 | 247 | 247 | 247 | 247 | 247 | 247 |
| Percent of missed workdays out of working days | 4.3% | 6.0% | 5.7% | 7.4% | 11.7% | 6.2% | |
| Percent of missed workdays more than the general workforce | 1.7% | 1.5% | 3.2% | 7.5% | 2.0% | ||
| Total alcohol use disorder and drug abuse attribution percentages | 1.5% | 12.7% |
This attribution factor is very conservative. NDIC’s 2011 report found that just drug misuse was responsible for a 17% reduction in productivity for men and an 18% reduction in productivity for women. For example, the National Safety Council observed that “Employees with an alcohol use disorder miss on average 34% more days than other workers and are more likely to experience a workplace injury.”40 The calculation also does not account for “presenteeism,” issues caused by employees who are present in the workplace but who are not fully functional.
40 https://www.nsc.org/work-safety/safety-topics/drugs-at-work/substances
Productivity Loss due to Crime
Table 2.9: Productivity Lost Due To Incarceration
| Jails | Federal Prison | State Prison | Annual Productivity (2019) | Jails ($M) | Federal Prison ($M) | State Prison ($M) | ||
| Male | ||||||||
| 18–19 | 803 | 200 | 1,497 | 15 to 24 years | $29,922 | $24.0 | $0.0 | $0.0 |
| 20–24 | 9,536 | 2,377 | 17,772 | 15 to 24 years | $29,922 | $285.3 | $6.0 | $44.8 |
| 25–29 | 15,760 | 3,928 | 29,371 | 25 to 34 years | $66,725 | $1,051.6 | $158.6 | $1,185.8 |
| 30–34 | 15,861 | 3,953 | 29,558 | 25 to 34 years | $66,725 | $1,058.3 | $262.1 | $1,959.8 |
| 35–39 | 15,459 | 3,853 | 28,809 | 35 to 44 years | $87,352 | $1,350.4 | $345.3 | $2,581.9 |
| 40–44 | 11,845 | 2,952 | 22,075 | 35 to 44 years | $87,352 | $1,034.7 | $336.6 | $2,516.5 |
| 45–49 | 10,239 | 2,552 | 19,082 | 45 to 54 years | $84,731 | $867.6 | $250.2 | $1,870.4 |
| 50–54 | 8,533 | 2,127 | 15,901 | 45 to 54 years | $87,352 | $745.3 | $222.9 | $1,666.8 |
| 55–59 | 6,023 | 1,501 | 11,224 | 55 to 64 years | $67,305 | $405.4 | $143.1 | $1,070.2 |
| 60–64 | 3,313 | 826 | 6,173 | 55 to 64 years | $67,305 | $223.0 | $101.0 | $755.5 |
| 65 or older | 2,911 | 726 | 5,425 | 65 to 74 years | $27,602 | $80.4 | $22.8 | $170.4 |
| Female | ||||||||
| 18–19 | 157 | 18 | 134 | 15 to 24 years | $28,982 | $4.6 | $0.0 | $0.0 |
| 20–24 | 2,580 | 294 | 2,197 | 15 to 24 years | $28,982 | $74.8 | $0.5 | $3.9 |
| 25–29 | 5,599 | 638 | 4,768 | 25 to 34 years | $50,057 | $280.3 | $14.7 | $110.0 |
| 30–34 | 6,040 | 688 | 5,143 | 25 to 34 years | $50,057 | $302.3 | $31.9 | $238.7 |
| 35–39 | 5,348 | 609 | 4,554 | 35 to 44 years | $58,183 | $311.1 | $40.0 | $299.3 |
| 40–44 | 3,743 | 426 | 3,188 | 35 to 44 years | $58,183 | $217.8 | $35.4 | $265.0 |
| 45–49 | 3,177 | 362 | 2,706 | 45 to 54 years | $58,249 | $185.1 | $24.8 | $185.7 |
| 50–54 | 2,359 | 269 | 2,009 | 45 to 54 years | $58,249 | $137.4 | $21.1 | $157.6 |
| 55–59 | 1,384 | 158 | 1,179 | 55 to 64 years | $49,417 | $68.4 | $13.3 | $99.3 |
| 60–64 | 629 | 72 | 536 | 55 to 64 years | $49,417 | $31.1 | $7.8 | $58.2 |
| 65 or older | 440 | 50 | 375 | 65 to 74 years | $24,587 | $10.8 | $1.8 | $13.2 |
| Total | $8,749.6 | $2,040.0 | $15,252.9 |
Productivity lost due to incarceration: Using the various 2017 datasets from the Bureau of Justice Statistics (BJS) we were able to identify the volume of inmates and prisoners and project it to 2019 by applying the annualized 2016-2017 percent change. Additional information on age and sex of inmates and prisoners and their most serious offense allowed us to segment the prisoner totals by age and sex, to apply the Annual Productivity per person (Table 2.2), and to identify those incarcerations attributed to substance abuse disorder (i.e., DUI or drug possession). In the sample, there was greater proportion of women with DUIs and drug possession sentences, but there was a higher percentage of men overall.
Victims of Crime
To calculate the total productivity loss due to victims of crime, we used the 2018 Crime Victimization report by the Bureau of Justice Statistics to obtain the updated volume of crimes. From there, we used the 2007 figures in the NDIC report to determine how to value the total productivity loss. We adjusted the mix in 2007 dollars based on the same percent change of the volume of crimes in each category (violent and property). We then adjusted it to 2019 dollars to obtain total cost of victims of crime and applied the same attribution rate for drugs (from NDIC 2004).
Table 2.10: Updated Volume of Crimes
| Category | Violent Crime | Property Crime |
| 2007 # of Crimes | 5,385,240 | 17,955,838 |
| 2018 # of Crimes | 6,385,520 | 13,502,840 |
| % Change | +19% | -25% |
Table 2.11: Total Productivity Lost
| Category | Violent Crime | Property Crime |
| 2007 Lost Productivity | $834,140 | $576,746 |
| 2007 Adjusted (2007 Dollars) | $989,077 | $433,715 |
| Inflation % | 123% | 123% |
| Inflation to 2019 Dollars | $1,219,553 | $534,779 |
| Attribution Rate | 12% | 31% |
| Productivity Value lost due to Crime in 2019 | $148,275 | $163,190 |
| Total Productivity Value Lost | $311,464 |
Crime, Law Enforcement, Criminal Justice
Summary
In order to estimate the cost due to Crime, Law Enforcement, and Criminal Justice, we broke out the categories to law enforcement (police at the State and Federal level and drug control in terms of Federal spending), judicial, correctional, private costs, and costs due to crime victims.
The indirect and direct costs due to crime, law enforcement, and criminal justice total $9.2 B annually, driven by law enforcement then judicial and private costs.
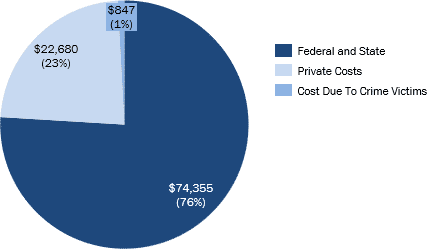
| Categories | Cost ($ M) | Adj. for Double Counting | % |
| Federal and State | $84,970 | $74,355 | 76% |
| Law Enforcement | $47,052 | $41,174 | 42% |
| Police Protection | $45,304 | $39,645 | 40.5% |
| State | $36,158 | $31,641 | 32.3% |
| Federal | $9,146 | $8,004 | 8.2% |
| Drug Control | $1,747 | $1,529 | 1.6% |
| Supply Reduction (federal) | $1,747 | $1,529 | 1.6% |
| Department of Agriculture | $15 | $13 | 0.0% |
| Department of Defense | $365 | $320 | 0.3% |
| Department of Homeland Security | $1,084 | $948 | 1.0% |
| Department of the Interior | $24 | $21 | 0.0% |
| Office of National Drug Control Policy | $183 | $160 | 0.2% |
| Department of State | $ | $ | 0.0% |
| Department of Transportation | $16 | $14 | 0.0% |
| Department of the Treasury | $60 | $53 | 0.1% |
| Supply Reduction (State) | $ | $ | 0.0% |
| Judicial | $4,715 | $4,126 | 4.2% |
| State | $3,202 | $2,802 | 2.9% |
| Federal | $1,512 | $1,323 | 1.4% |
| Correctional | $33,203 | $29,055 | 29.7% |
| State | $29,166 | $25,523 | 26.1% |
| Federal | $4,037 | $3,533 | 3.6% |
| Private Costs | $25,917 | $22,680 | 23.2% |
| Private Legal Defense | $24,944 | $21,828 | 22.3% |
| Private Security Costs | $974 | $852 | 0.9% |
| Property Destruction due to Crime | $968 | $847 | 0.9% |
| Total | $111,855 | $97,882 | 100.0% |
*Other costs due to crime victims are in the intangible costs and health sections
Methodology and Analysis
Federal and State Government
Table 3.1: Federal and State Government Spend on Crime due to Substance Abuse Disorder
| Level | Category | Total Spend ($M) – 2019 | Attribution Proportion | Total Costs ($M) |
| State | Law Enforcement | $117,412 | 31% | $36,158 |
| Judicial | $49,050 | 7% | $3,202 | |
| Correctional | $82,445 | 35% | $29,166 | |
| Federal | Law Enforcement | $29,700 | 31% | $9,146 |
| Judicial | $15,395 | 10% | $1,512 | |
| Correctional | $7,340 | 55% | $4,037 | |
| Total | Law Enforcement | $45,304 | ||
| Judicial | $4,715 | |||
| Correctional | $33,203 |
To find the total 2019 Federal and State government justice expenditure, we averaged of two closely related approaches. The first approach utilized the expenditure growth 5-year CAGR from 2011-2016 (the year of the most recent reported expenditures by the BJS) to estimate 2019 spending. For the other approach, we adjusted the 2016 expenditures for inflation to 2019 dollars. Both estimates were reasonably close to one another, so we used the average value.
For the attribution proportion for law enforcement, we used the proportion of arrests that were related to identifiers for drug abuse, driving under the influence, liquor laws, and drunkenness, and applied the same proportion to both State and Federal law enforcement values. For judicial spending, the National Center for State Courts reported that in 2016, about 22% of State court cases were criminal-related, and so we applied this to the law enforcement attribution proportion. As for the Federal judicial attribution proportion, the United States Courts reported about 10% of Federal cases were drug offenses. Though this accounts only for drugs, due to the fact that Lewis (2006) reported that the Federal corrections alcohol attribution was only 5% while the BJS (2014) stated 50% of prisoners were incarcerated for drug offenses, we felt comfortable using the drug attribution factor only for the Federal judicial category. Both the State and Federal correctional attribution proportions were obtained from the BJS 2014 report on prisoners in the US, which stated the drug attribution proportion, and the Lewis 2006 report for the alcohol attribution proportion.
Private Costs
Lawyer
Table 3.2: Cost of Private Lawyers due to Substance Abuse Disorder
| GDP By Industry (2018) – Private Legal Services | Inflated to 2019 ($M) | % of Criminal Drug Offenses Filed | Value to Due to Drugs ($M) |
| $266,300 | $271,125 | 9% | $24,944 |
We used the Bureau of Economic Analysis’ estimation of the Private Legal Services GDP from 2018 and inflated it to 2019. We then applied the percent of drug offenses filed from the US Attorneys’ Annual Statistical report to calculate the estimated value of the industry due to drugs.
Security
Table 3.3: Cost of Private Security due to Substance Abuse Disorder
| Number of jobs (2017) | Number of jobs (2018) | Update to 2019 | Median Annual Wages | Percent in Relevant Locations | % of Crime Related to Drugs/Alcohol | Total Cost ($M) |
| 1,105,440 | 1,143,800 | 1,183,491 | 32,183 | 8.4% | 31% | $974 |
We estimated the proportion of the total number of security guards who work in locations where alcohol consumption is likely to be relevant to any problematic activity. For example, we included security guards at retail sales locations (including groceries, merchandise, etc.), spectator sports or promotional sports events, any other live entertainment venue, and any locations including food and drink such as restaurants, bars, clubs, etc. This came out to be around 8.4% of total security employment. We then multiplied the total number of security guards by average annual salary, percent that work in relevant areas (8.4%), and percent of arrests related to drug and alcohol (31%), to come up with an estimated annual cost of security related to substance abuse disorders.
Costs due to Crime Victims
Property Loss
Table 3.4: Adjusted Cost due to Inflation ($M)
| Category | NDIC (2011) | Inflation | 2019 |
| Property Loss Violent Crime | $125 | 111% | $139 |
| Recovered Rate | 11% | ||
| True Rate | $15 | ||
| Property Loss Property Theft | $802 | 111% | $893 |
| Recovered Rate | 26% | ||
| True Rate | $232 |
To calculate the total property loss due to substance abuse disorder related crimes, we used the 2018 Crime Victimization report by the Bureau of Justice Statistics to obtain the updated volume of crimes. From there, we used the 2011 NDIC reports estimate on the value of property loss for both violent and property related crimes. We adjusted the mix in 2007 dollars based on the same percent change of the volume of crimes in each category (violent and property), the damage rate, and then calculated the total property loss.
Table 3.5: Cost of Property Loss due to Substance Abuse Disorder
| Category | Violent | Property | Total |
| Number of Crime Victimization (2018) | 6,385,520 | 13,502,840 | 19,888,360 |
| Number of Crimes (2018) | 1,206,836 | 7,196,045 | 8,402,881 |
| Weighted Attribution Factors | 12% | 31% | |
| Number of Drug Events | 776,358 | 4,120,438 | 4,896,796 |
| Property cost Per Event | $139 | $893 | |
| Damage Rate | 11% | 26% | |
| Loss Per Event | $15 | $232 | |
| Subtotal ($M) | $12 | $956 | $968 |
Traffic Collisions
Summary
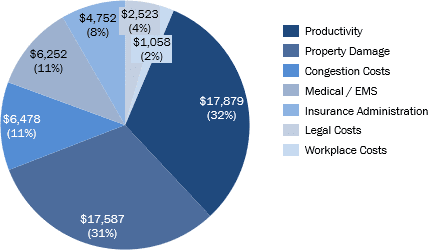
Society has long understood the connection between alcohol use and impaired driving. In 2017, 29% of all fatal traffic crashes involved alcohol-impaired driving. However, there are limited studies on the influence of drugs on traffic collisions. It is difficult to determine the proportion of crashes due to “drugged” driving because of the lack of a good roadside drug test and length of time a drug may persist in the body after use. According to the Fatality Analysis Reporting System (FARS) by the NHTSA, 42% of fatally injured drivers tested positive for drugs in 2016 (however, drug tests do not necessarily fully correlate with driver impairment due to the length of time tests may remain positive, for example).
The traffic collision costs associated with substance abuse disorders total $20.1 B annually, mainly driven by property damage and market productivity and congestion costs and medical costs.
| Categories | Costs ($M) | Double Ct. Adj. | % of Total |
| Medical / EMS | $7,145 | $6,252 | 11% |
| Medical | $6,860 | $6,003 | 10.6% |
| Emergency Services | $285 | $249 | 0.4% |
| Productivity | $20,432 | $17,879 | 32% |
| Market Productivity | $15,216 | $13,315 | 23.6% |
| Household productivity | $5,216 | $4,564 | 8.1% |
| Insurance Administration | $5,430 | $4,752 | 8.4% |
| Workplace Costs | $1,209 | $1,058 | 1.9% |
| Legal Costs | $2,884 | $2,523 | 4.5% |
| Subtotal | $37,099 | $32,464 | 57.4% |
| Congestion Costs | $7,402 | $6,478 | 11.5% |
| Property Damage | $20,098 | $17,587 | 31.1% |
| Total | $64,599 | $56,529 | 100.0% |
Methodology and Analysis
The National Highway and Traffic Safety Administration (NHTSA) conducted an analysis on motor vehicle crashes in 2015, which reported the economic and societal costs of traffic collisions in 2010. The report founded that the total economic cost of traffic collisions is $242 billion dollars, with property damage and market productivity making the largest categories (Table 4.1).
However, we also accounted for the increasing number of traffic collisions that occurred since 2010 by applying the volume growth CAGR to the overall costs (Table 4.2).
The NHTSA 2015 report also indicated that 22% of the total cost were crashes where alcohol was present, but 18% of the total costs were due to crashes specifically caused by alcohol. Determining an attributional factor for drugs is more difficult due to several factors, including a lack of a good roadside test for drugs and the fact that some drugs remain in a person’s system for days or weeks, making it difficult to determine the impact of drugs on the accident. Furthermore, law enforcement officers may not typically conduct drug testing if the driver is found to have exceeded the legal BAC level as there is enough evidence for a DUI charge; in addition, since drivers can have both alcohol and drugs in their system, it is difficult to assign proportional responsibility for a particular substance in addition to alcohol. NHTSA attempted to determine the drug attribution rate by conducting a small study on the impact of drugs and alcohol on driving and found that 16% drivers involved in a traffic crash were positive for drugs and alcohol. Given the lack of studies on the impact of drugs on traffic collisions, we used the 18% as a conservative estimate for the attributable proportion of substance abuse disorder on traffic collisions. We considered the proportion of fatal crashes due to alcohol over time to account for any changes in the attributable factor. Since 2010, the proportion of fatal crashes involving alcohol- impaired driving has remained relatively constant at about 30%, and therefore we assumed a constant 18% attributable factor. In addition, though alcohol-impaired driving does not necessarily imply alcohol abuse, because we are using only the alcohol attribution factor, our overestimation in this sense may account for the underestimation due to the lack of a drug attribution factor.
Table 4.1: Number of Traffic Crashes and Alcohol-Related Fatal Crashes
| Categories | 2010 | 2011 | 2012 | 2013 | 2014 | 2015 | 2016 | 2017 | 2010-17 CAGR |
| Number of Crashes (In Thousands) | 5,419 | 5,338 | 5,615 | 5,687 | 6,064 | 6,296 | 6,821 | 6,452 | 2.5% |
| Fatal Crashes (In Thousands) | 30.2 | 29.8 | 30.8 | 30.1 | 30.0 | 32.2 | 34.4 | 34.2 | 1.8% |
| Alcohol-Related Fatal Crashes (InThousands) | 9.3 | 9.0 | 9.4 | 9.2 | 9.1 | 9.3 | 9.5 | 9.9 | 0.9% |
| Proportion of Alcohol- Related FatalCrashes | 31% | 30% | 30% | 30% | 30% | 29% | 28% | 29% |
Public Assistance and Social Services
Summary
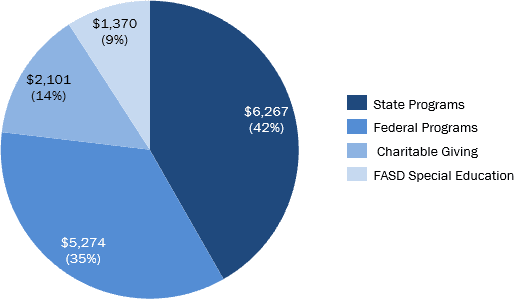
Social welfare programs such as Old Age, Survivors, and Disabilities Insurance (OASDI) and Supplemental Nutrition Assistance Program (SNAP) can provide assistance to people with substance abuse disorders. Therefore, a proportion of these programs administrative spend is attributable to substance abuse disorder. In addition, a proportion of child welfare is attributable to substance abuse disorder as substance abuse disorder is one of the major contributing factors for child removal. According to the National Center on Substance Abuse and Child Welfare (NCSACW), about 35% of child removal is due parental alcohol or other drug use in the United States in 2016. However, child welfare is considered a direct transfer or redistribution of payments.
Therefore, a proportion of the total child welfare expenditures is considered rather than utilizing an administration cost.
Fetal alcohol syndrome disorder (FASD) is a condition in a child that results from alcohol exposure while in the womb. Studies have shown 0.2 to 1.5 infants out of 1,000 live births have FASD. Though medical and productivity loss costs were measured in the previous sections, special education costs were calculated in this section.
Another source of spending is charitable giving to organizations and non-profits focused on substance abuse disorder and homelessness related to substance abuse disorder. According to Giving USA, in 2018, Americans gave $428 billion dollars to charity, with 13% going to human services and 10% going to health organizations.
The direct and indirect public assistance and social services costs associated with substance abuse disorders total $17.2 B annually, mainly driven by State and Federal spending and followed by charitable given and Fetal Alcohol Syndrome Disorder special education costs.
| Categories | Costs ($M) | Double Ct. Adj. | Percent of Total |
| Federal | $6,027 | $5,274 | 35.1% |
| Administrative Expenses From: | $377 | $330 | 2.2% |
| Old Age, Survivors, and Disabilities Insurance (OASDI); | $115 | $101 | 0.7% |
| Supplemental Security Income (SSI) | $136 | $119 | 0.8% |
| Temporary Assistance for Needy Families (TANF) | $62 | $54 | 0.4% |
| Supplemental Nutrition Assistance Program (SNAP | $14 | $13 | 0.1% |
| Veteran’s compensation and pension | $49 | $43 | 0.3% |
| Child Welfare Costs | $5,650 | $4,944 | 32.9% |
| State | $7,161 | $6,267 | 41.7% |
| Temporary Assistance for Needy Families (TANF) | $42 | $37 | 0.2% |
| Supplemental Nutrition Assistance Program (SNAP | $263 | $230 | 1.5% |
| Child Welfare Costs | $6,856 | $6,000 | 40.0% |
| Fetal Alcohol Syndrome Disorder Costs and Care | $1,565 | $1,370 | 9.1% |
| Charitable Giving | $2,401 | $2,101 | 14.0% |
| Total | $17,155 | $15,012 | 100.0% |
Methodology and Analysis
The social welfare programs considered in this analysis were Old Age, Survivors, and Disabilities Insurance (OASDI), Supplemental Security Income (SSI), Temporary Assistance for Needy Families (TANF), Supplemental Nutrition Assistance Program (SNAP), Veterans Benefits Administration, and Child Welfare Payments in accordance to the methodology found in previous reports including the National Institute on Drug Abuse (NIDA) report “The Economic Costs of Alcohol and Drug Abuse in The United States 1992” and the State of Maine report “The Cost of Alcohol and Drug Abuse in Maine, 2015.” The most current administrative spend for each program except child welfare were considered. The spend was adjusted to 2019 dollars if necessary. The substance abuse disorder attribution proportion from the NIDA and Maine reports were utilized. For child welfare payments, we utilized the proportion of child removal due to parental alcohol or another drug use from the NCSACW, using the historical CAGR from 2010 to 2016 to approximate the 2019 value of 39%.
Table 5.1: Federal and State Social Welfare Program Administrative Expenditure
| Categories | Spend ($M) | Attribution Factor | Adj. Spend ($M) |
| Federal | |||
| Child Welfare | $14,382 | 39% | $5,650 |
| Old Age, Survivors, and Disabilities Insurance (OASDI) | $6,777 | 1.7% | $115 |
| Supplemental Security Income (SSI) | $4,546 | 3.0% | $136 |
| Veterans Benefits Administration | $2,869 | 1.7% | $49 |
| Temporary Assistance for Needy Families (TANF) | $1,197 | 5.2% | $62 |
| Supplemental Nutrition Assistance Program (SNAP) | $277 | 5.2% | $14 |
| Total | $6,027 | ||
| State | |||
| $17,452 | 39% | $6,856 | |
| Temporary Assistance for Needy Families (TANF) | $806 | 5.2% | $42 |
| Supplemental Nutrition Assistance Program (SNAP) | $5,054 | 5.2% | $263 |
| Total | $7,161 |
For FASD, we took the average from two studies, the Lewin Group 2006 and the Journal of Addiction Medicine 2018. The Lewin Group annual expected costs of special education were adjusted to 2019 dollars and were multiplied by the current prevalence of FASD. The Journal of Addiction Medicine paper conducted a comprehensive literature review of 20 US, 9 Canadian, and 2 other studies to determine the annual cost of FASD per person for special education, which was adjusted to 2019 dollars and multiplied by the current FASD prevalence.
Table 5.2: FASD Special Education Expenditure
| Source | Age Group | Population | Annual Cost (2019) | Total Cost ($M) |
| Lewin Group (2006) | <18 | 73,783 | $8,184 | $604 |
| 18 – 77 | 240,236 | $168 | $40 | |
| Total | $644 | |||
| Journal of Addiction Medicine 2018 | All Ages | 330,269 | $7,528 | $2,486 |
| Average | $1,565 |
For charitable giving, the two main categories we focused on from the Giving USA 2019 report were human services and health organizations. We utilized the IRS Exempt Organization Business Master File Extract to find the total income and revenue of all human service charities and non-profits. We then found the total income and revenue of organizations related to homelessness and housing services, which were subsectors of human services, and determined the proportion over the entire human services. This factor was 12%. According to SAMHSA, 35% of homeless adults had a chronic substance abuse disorder issue. The combined attribution factor of health charitable giving that is homelessness related to substance abuse disorder is 4%. For health organizations, we utilized the same IRS file to determine what proportion of health organizations revenue and income were those of substance abuse disorder organizations and applied this proportion to the overall health organization charitable giving amount.
Table 5.3: Charitable Giving Related to Substance Abuse Disorder
| Category | Amount ($M) | Attribution Factor | Total Amount ($M) |
| Human Services | $52,997 | 4.1% | $2,186 |
| Health Organizations | $41,933 | 0.5% | $215 |
| Total | $2,401 |
Fires
Summary
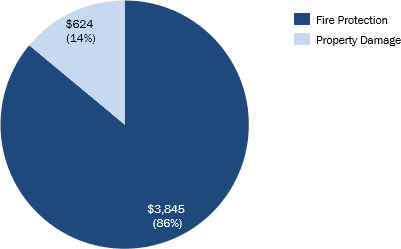
The total cost of fire in the US in 2014 was $329 billion dollars, with $13 billion dollars attributable to property loss. Based on the Lewin Group 2006 report, the National Fire Protection Association (NFPA) reported that 5% of overall property damage caused by fires was the result of alcohol-related ignition, showing the association of fires and substance abuse disorder. The NFPA also reported that in 2013-2017, about 15% of home fire deaths and 10% of home fire injuries were due to substance abuse disorder.
The indirect fire damage and protection costs associated with substance abuse disorders total $5.1 B annually, mainly driven by fire protection services and then fire damages or destruction.
| Categories | Costs ($M) | Double Ct. Adj. | Percent of Total |
| Fire Protection Services | $4,393 | $3,845 | 86% |
| Fire Damages/Destruction | $713 | $624 | 14% |
| Total | $5,106 | $4,468 | 100% |
Methodology and Analysis
The total salary of fire protection employees (including fire fighters) were considered to determine the fire protection service costs. According to the US Census Bureau, there were 437,282 fire protection service employees with an average salary of $65,789 in 2018. The total amount was adjusted to 2019 dollars. We
utilized the 15% attribution proportion based on home fire deaths for fire protection services, as fire service employees are responsible for both putting out fires and rescuing people from fires.
For fire damages, we utilized the NFPA 2017 report on the total cost of fires in the US in 2014. For fire damage, we utilized the 5% attribution proportion as a conservative estimate for the cost of fire damage related to substance abuse disorder. Determining fire property damage due to drugs is difficult because of the similar reasons as mentioned in the traffic collision section. We did not utilize the higher proportion of 15% because alcohol-related fire casualties are related more to people who are impaired and eventually are exposed to fire than fire property damage.
Research and Prevention
Summary
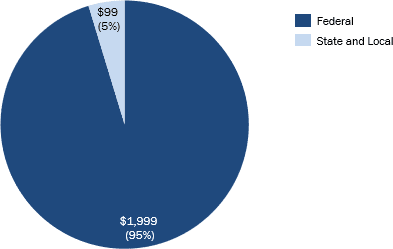
The Federal and State government allocate funds for the research and prevention of substance abuse disorder in the US. The costs associated with substance abuse disorders total $3.3 B annually by primarily federal but also state costs.
| Categories | Costs ($M) | Double Counting Adjustment | Percent of Total |
| Federal | $2,285 | $1,999 | 95% |
| State | $113 | $99 | 5% |
| Total | $2,398 | $2,098 | 100% |
Methodology and Analysis
Every year, the President’s National Drug Control Strategy Budget is submitted to Congress, detailing the drug control budget for each Federal department. The budget outlines the prevention and research requests for each department. We took the sum of all the departments’ research and prevention budget request, which totaled to $2.3 billion dollars.
According to the National Association of State Alcohol and Drug Abuse Directors, the total State substance abuse disorder prevention expenditures in 2018 was $567M, with 19% from State and local funds. The total State funds for substance abuse disorder prevention, after adjusted to 2019 dollars, is $111 million dollars. Since this amount is only for prevention, we used the proportion of Federal research and prevention that is research to approximate total State research and prevention expenditure. Research made up only 2% of the Federal total research and prevention budget, and therefore the total State research and prevention funds slightly increased to $114 million dollars.
Table 7.1: 2019 Federal Prevention and Research Budget by Department
| Department | Sub-department | Category | Budget ($M) |
| Department of Agriculture | Office of Rural Development | Prevention | $4 |
| Court Services and Offender Supervision Agency for the District of Columbia | All | Prevention | $25 |
| Department of Defense | Office of the Secretary Defense | Prevention | $121 |
| Department of Defense | Defense Health Program | Research and Development | $28 |
| Department of Education | Office of Elementary and Secondary Education | Prevention | $55 |
| Federal Judiciary | All | Research and Development | $7 |
| Department of Health and Human Services | Administration for Children and Families | Prevention | $40 |
| Centers for Disease Control and Prevention | Prevention | $476 | |
| Health Resources and Services Administration | Prevention | $111 | |
| Indian Health Service | Prevention | $25 | |
| National Institute of Health | Research and Development: Prevention | $602 | |
| Substance Abuse and Mental Health Services Administration | Prevention | $600 | |
| Department of Homeland Security | United States Coast Guard | Research, & Development | $2 |
| Department of the Interior | Bureau of Indian Affairs | Prevention | $1 |
| Department of Justice | Drug Enforcement Administration | Prevention | $8 |
| Office of Justice Programs | Prevention | $24 | |
| Department of Labor | Employment and Training Administration | Prevention | $6 |
| Office of Worker’s Compensation Programs | Prevention | $8 | |
| Office of National Drug Control Policy | High Intensity Drug Trafficking Areas | Prevention | $3 |
| High Intensity Drug Trafficking Areas | Research and Development | $3 | |
| Other Federal Drug Control Programs | Prevention | $102 | |
| Other Federal Drug Control Programs | Research and Development | $13 | |
| Salaries and Expenses | Prevention | $3 | |
| Department of Transportation | Federal Aviation Administration | Prevention | $17 |
| National Highway Traffic Safety Administration | Prevention | $2 | |
| National Highway Traffic Safety Administration | Research and Development: Prevention | $1 | |
| Prevention* | $2,232 | ||
| Research | $52 | ||
| Total | $2,285 |
*Research and Development: Prevention was classified in “Prevention”
III. INTANGIBLE COSTS
Intangible Costs
Summary
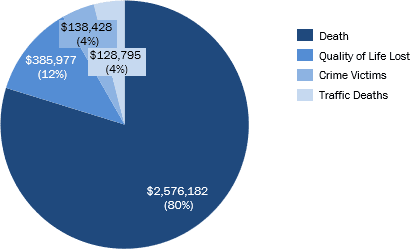
The intangible cost of substance abuse disorder ($3.23 T) measures the non-financial welfare losses such as reduced quality of life, death, and injury. The biggest intangible cost of substance abuse disorder is the loss in the quality of life or productivity of people with substance abuser disorders who do not receive treatment.
Death is an intangible cost based on the value of a statistical life, which indicates what a person is willing to spend to avoid death. Another intangible cost is the pain and suffering and risk of death of crime victims. The final intangible costs we analyzed were the costs involving traffic injuries.
| Intangible Costs Categories | Costs ($M) | Double Ct. Adj. | Percent of Total |
| Death | $2,943,951 | $2,576,182 | 80% |
| Quality of Life Lost | $441,078 | $385,977 | 12% |
| Crime Victims | $158,190 | $138,428 | 4% |
| Traffic Deaths | $147,181 | $128,795 | 4% |
| Total | $3,690,400 | $3,229,382 | 100% |
Methodology and Analysis:
For certain sections of this analysis, we required a financial estimate for the value of a statistical life, sometimes defined as “the willingness of people to pay to avoid death.” We obtained this value from multiple sources, adjusted the values to 2019 dollars, and used the average, which was $10.6 million dollars (Table 8.1) per life. Government departments such as the Environmental Protection Agency (EPA) and U.S. Department of Transportation (DOT) determined their VSL number by taking an average values across multiple studies. The two most common ways to determine VSL are the “revealed preference approach” and “stated preference approach.” The revealed preference approach relies mainly on labor market statistics by comparing the wages and death rates of various occupations across multiple industries. The stated preference approach is based on hypothetical decisions rather than actual behavior, usually involving asking people what they might do in certain situations that involves a monetary/ safety tradeoff. The U.S. DOT drew on labor market studies that utilized the Census of Fatal Occupational Injuries (CFOI) fatality rate data, while the EPA took a combination of both revealed preference and state preference studies. According to Kniesner et al. 2019, the basic structure for determining the VSL using labor statistics is: VSL = ( ̂^’× ) × ℎ × (1/p)
- where ̂’ = a heterogeneity coefficient that factors both demographic (such as age and education) and other job characteristic variables (such as non-fatal injury risk, workers’ compensation insurance coverage, and industry and occupation indicators)
- w = wage value
- h = total number of hours per work year
- p = is the number of deaths per worker
Table 8.1: Value of Statistical Life
| Source | Value of Statistical Life ($M) | Inflation Adjustment | Value of Statistical Life – Adjusted 2019 ($M) |
| EPA (2007) | $9.6 | 107% | $10.3 |
| NHTSA (2012) | $7.4 | 142% | $10.5 |
| DOT (2016) | $9.1 | 120% | $10.9 |
| Vanderbilt Law (2017) | $10.0 | 105% | $10.5 |
| Average | $10.6 |
Death
To determine the intangible cost of death, we applied the value of a statistical life. We utilized the total number of deaths from drugs and alcohol to calculate the total cost of death due to substance abuse disorder. To avoid double counting productivity loss due to premature mortality, we subtracted the total productivity loss due to premature death from the previous analysis to find the net total intangible cost of death due to substance abuse disorder (Table 8.4)
Table 8.2: Intangible Costs of Death Due to Substance Abuse Disorder
| Value of Statistical Life ($M) | Deaths from Drugs and Alcohol | Cost of Death Due to Drugs and Alcohol ($M) | Economic Productivity Loss ($M) | Difference- Intangible Cost ($M) |
| $10.6 | 295,735 | $3,130,509 | $179,186 | $2,943,951 |
Quality of a Life Lost
Of the 21 million people who might have benefitted from substance abuse disorder treatment in the US in 2019, only 2 to 3 million people received treatment. This leaves about 19 million people who did not receive substance abuse disorder treatment. We utilized the average value of a statistical life calculated in Table 8.1, annualized it using the average life expectancy (78.6 years) and the proportion of each life lost to productivity to find the total quality of life lost (Table 8.3).
Table 8.3: Intangible Costs Due to Quality of Life Lost of Substance Abuse Disorder
| Number of People with SUD Who Don’t Receive Treatment – 2018 | Value of a Life ($M) | Annualized Value of a Life | % Lost to Productivity | Quality of Life Lost ($M) |
| 18,715,000 | $10.6 | $134,675 | 18% | $441,078 |
Crime Victims
For the calculation of intangible cost of crime, we utilized the Drug and Alcohol Dependence journal 2010 study on the cost of crime. According to the study, the intangible costs of crime include the pain and suffering cost and the risk-of-homicide costs. The pain and suffering costs were calculated by utilizing jury compensation for injury related to crime and the probability of injury for each type of crime. The risk-of-homicide cost factors in the risk of homicide for each type of criminal offense. We adjusted these costs to 2019 dollars. We also found the most updated number of cases for each type of criminal offense and utilized attribution factors based on the averages from the NIDA report and Bureau of Justice reports to calculate the total intangible cost per crime (Table 8.5).
Table 8.4: Intangible Costs of Crime Victims Related to Substance Abuse Disorder
| Categories | # Cases 2018 | Attribution Factor | Intangible Costs- 2019 | Total Intangible Costs ($M) |
| Violent Crime | ||||
| Murder | 16,214 | 32% | $11,557,297 | $60,027 |
| Rape/Sexual Assault | 734,630 | 27% | $273,315 | $54,212 |
| Aggravated Assault | 1,058,040 | 28% | $130,089 | $38,768 |
| Robbery | 573,100 | 28% | $30,906 | $4,894 |
| Property Crime | ||||
| Motor Vehicle Theft | 748,841 | 18% | $359 | $47 |
| Arson | 36,127 | 25% | $7,027 | $63 |
| Household Burglary | 1,230,149 | 29% | $439 | $158 |
| Larceny/Theft | 5,217,055 | 29% | $14 | $20 |
| Total | $158,190 |
Traffic Injuries (Non-Fatalities)
The NHTSA reported the total intangible cost of traffic collisions due to alcohol to be $150 million dollars in 2010. Since we had already factored the cost of fatalities into the section on deaths, here, we specially looked at the intangible costs due to non-fatal traffic injuries. Similar to the analysis in the traffic section, we adjusted the total cost by the growth in the number of traffic collisions and for inflation (Table 8.6).
Table 8.5: Intangible Costs Due to Traffic Injury Related to Alcohol
| Intangible Cost Due to Alcohol – 2010 ($M) | Intangible Cost – Fatalities ($M) | Intangible Cost – Non- Fatalities ($M) | Growth in Collisions | Inflation Adjustment | Intangible Costs due to Alcohol ($M) |
| $150,019.36 | $58,364.42 | $91,654.94 | 125% | 128% | $147,181 |
IV. Cost of Treatment vs. No Treatment
Summary:
In evaluating the potential costs and benefits of treating 100% of the population needing assistance with substance abuse disorder, Marwood employed the methodology from the RCA September 2017 analysis, updated to reflect more current numbers and to fix inaccuracies.
Marwood concluded that if everyone in the United States that needed treatment for substance abuse disorder received it, the total cost of treatment would be $339.1 billion. In this scenario, the estimated overall costs to society, including intangible costs, would be $2.5 trillion. Considering the current overall cost estimate of $3.7 trillion, universal treatment for substance abuse disorder would reduce overall societal costs by $1.2 trillion, more than 32%.
Analysis:
We calculated the cost of treatment first, by dividing total treatment costs by the number of persons that had received treatment in the corresponding year. Our analysis estimated cost of treatment as $15,960 per person per year.
Table F.1: Cost of Treatment Per Person in 2018
| Cost of Treatment Per Person in 2018 | |
| Cost of Specialty Treatment ($M) 41 | $40,378 |
| # of People with SUD that Received Treatment | 2,530,000 |
| Cost of Treatment Per Person | $15,960 |
41 The total cost of treatment is from Table 1.21 (Community Based Treatment) and Table 1.22 (Federal Based Treatment)
Next we calculated avoidable costs. Collins and Lapsley (2002) in “Counting the cost: estimates of the social costs of drug abuse in Australia in 1998-9” stated 47.9% of tangible costs and 63.2% of intangible costs associated with alcohol misuse disorders are avoidable. These avoidable cost estimates assume a sufficiently long time period for the effects of past abuse to be totally removed from society and for any anti-abuse policies to take full effect. The avoidable costs estimates cannot be interpreted to represent potential rapid returns to anti-abuse policies and programs. The article notes a problem in identifying the avoidable proportions of illicit drug costs generally. It is expected that appropriate policies could lead to a reduction illicit drug costs, but it was not possible to identify any basis for estimating the appropriate proportion, so those costs are excluded from the analysis. The “International Guidelines for the Estimation of the Avoidable Costs of Substance Abuse” (2006) refer to the Collins and Lapsley 2002 report and states “Although few estimates have been made of avoidable costs, those that have been made indicate that avoidable costs represent in the order of fifty per cent of aggregate costs”. An article in the Journal of Occupational Environmental Medicine from 2017 (Goplerud, Hodge, Benham) notes “Employers who self-insure and provide individual coverage pay $1,729 per employee with no SUD each year (estimates of the costs of workers’ health care use from the NSDUH are likely to be lower than actual costs because the survey does not inquire about medications or laboratory tests, and 12-month recall may be imprecise.) A worker with a SUD uses health care services that cost his/her employer
$2,197. The difference is primarily a result of greater emergency department use by the latter. Workers with a pain medication use disorder cost more than twice that much as workers with no SUD: $5,586.” This indicates that employers pay approximately 27% more for workers with SUD. Given that the 2017 number is only considering health care services costs, we used the attribution rates from Collins and Lapsley 2002 report.
In our analysis, this suggests that $16.0 billion in direct and indirect costs, and $135.6 B in intangible costs of substance abuse disorders can be avoided.
Table F.2: Avoidable Costs
| Direct & Indirect | Intangible | |
| Total Cost of Substance Abuse Disorder ($M) | $501,277 | $3,229,382 |
| Avoidable (%) | 47.9% | 63.2% |
| Total Avoidable Cost ($M) | $240,112 | $2,040,969 |
| Avoidable Total Cost Per Person with SUD Needing Treatment | $11,302 | $96,068 |
| Avoidable Cost Per Person with SUD Needing Treatment – People That Have Received Treatment and Relapsed | $12,018 | $102,151 |
| Relapse % Assumption | 50% | 50% |
| Cost Avoided in 2019 ($M) | $15,947 | $135,554 |
We then divided total avoidable costs by the total number of people needing substance abuse disorder treatment (~21.2 M people) to find avoidable cost per person.
Next, we calculated the new avoidable cost, by multiplying the new number of people with substance abuse disorders by avoidable cost per person to find the new total avoidable cost to society. To estimate the new number of people with substance abuse disorder, we multiplied the total number of people that needed SUD treatment by 50% to get the number of people that relapsed and added it to the total number of people that needed SUD treatment. The 50% relapse rate for substance abuse disorders is the average of the 40-60% range given by the 2000 JAMA article “Drug Dependence, a Chronic Medical Illness” that is also cited by the National Institute on Drug Abuse. We multiplied the number of people with the avoidable cost per person with SUD needing treatment. We then added the new avoidable cost to the previously calculated unavoidable cost to find the new total cost to society. We then compared our hypothetical calculations laid out in the above scenario with our real-world calculations to find the value add of comprehensive treatment for substance abuse disorder.
In our analysis, we can see that universal treatment for persons with substance abuse disorder results in a $211.4 B reduction in Direct & Indirect societal benefits. However, this is more than offset by the significant $746.0 B gains in intangible benefits to society to get $534.6 B in total benefit.
Table F.3: Cost to Society
| Direct & Indirect | Intangible | |
| Total Unavoidable ($M) | $261,165 | $1,188,413 |
| # People That Relapsed That Needed But Did Not Receive SUD Treatment | 9,357,500 | 9,357,500 |
| New Avoidable ($M) | $112,455 | $955,874 |
| New Total Cost of Substance Abuse Disorder ($M) | $373,620 | $2,144,287 |
| $2,517,907 | ||
| Previous Total Cost of Substance Abuse Disorder ($M) | $501,277 | $3,229,382 |
| Difference (Total Cost of Substance Abuse Disorder-New Total cost of Substance Abuse Disorder) ($M) | $127,657 | $1,085,095 |
| Cost if Everyone Received Treatment ($M) | $339,063 | $339,063 |
| Benefit (Difference – Cost if everyone Received Treatment) ($M) | -$211,406 | $746,032 |
| Total Benefit ($M) | $534,625 | |
| ROI (Cost to Benefits) | 0.38 | 3.2 |
V. Opioids
Summary

Table G.1: Estimated Cost of Non-Medical Opioid Use in the United States, $ Cost in Billions (2015-2019)
| Categories | 2015 | 2016 | 2017 | 2018 | 2015-18 Total | 2019 Estimate* | 2015-19 Total |
| Healthcare Costs | $36.7 | $51.7 | $55.8 | $60.4 | $204.6 | $65.1 | $269.7 |
| Mortality Costs | $47.3 | $62.2 | $71.2 | $72.6 | $253.3 | $74.1 | $327.4 |
| Criminal Justice Costs | $8.9 | $9.2 | $9.8 | $10.9 | $38.8 | $12.2 | $50.9 |
| Child & Family Assistance Costs | $9.3 | $8.5 | $7.8 | $7.8 | $33.4 | $7.8 | $41.1 |
| Education Costs | $1.4 | $1.3 | $1.2 | $1.2 | $5.2 | $1.3 | $6.5 |
| Productivity Loss Costs | $20.7 | $23.5 | $25.0 | $26.5 | $95.7 | $28.0 | $123.7 |
| Total | $124.3 | $156.4 | $170.9 | $179.4 | $631.0 | $188.4 | $819.3 |
*The Society of Actuaries provides a low, midpoint, and high estimate for 2019. For the purposes of this summary table, the midpoint estimate is shown.
Background
According to the CDC, between 1999 and 2018, an estimated 450,000 people have died from a drug overdose involving prescription or illicit opioid and approximately 130 people continue to die every day from an opioid-related overdose.42
Overdose mortality is only one of the drastic consequences of the opioid epidemic. The epidemic and opioid use disorder (OUD) also adversely impact the economy and have high costs to society, including increased healthcare spending associated with treatment and services for those with OUD, losses in lifetime earnings due to premature mortalities, costs associated with criminal justice issues, funding for child and family assistance programs often run by the government, and productivity loss. Understanding the scope of the opioid epidemic and its economic burden is crucial for policy and decision makers to make informed choices and address the opioid crisis.
An article published by the Society of Actuaries in October 2019 estimated the total economic cost of the opioid epidemic from 2015 to 2018 to be at least $631 billion, not including other potential costs such as losses in unpaid household productivity and reductions in quality of life for which there is insufficient data to make estimates. The bulk of the estimated economic impact (approximately 40%) is accounted for by mortality costs. Healthcare costs due to additional spending for OUD treatment and related services make up an additional 32% of the estimated costs between 2015 and 2018. The remaining costs associated with criminal justice activities, child and family assistance, education programs, and productivity loss are roughly 6%, 5%, 1%, and 15%, respectively, of the total $631B cost. Using a midpoint estimate between the low and high cost scenarios for 2019, the economic burden of the opioid epidemic between 2015 and 2019 is estimated to be at least $819B.
In a 2017 report by the Council of Economic Advisors (CEA), the cost of the opioid crisis was estimated by further accounting for the value of a statistical life (VSL) in addition to the cost categories described above. By considering the value of lost lives and the economic impact of lives beyond premature mortality, the CEA estimated the economic burden of the epidemic at $2.5 trillion for the time period between 2015 and 2018.43 While the use of VSLs is common for cost-benefit analyses, we have chosen to report the findings by the Society of Actuaries, which provides more recent estimates and follows a similar analytical approach to the other estimates made in this report.
42 https://www.cdc.gov/drugoverdose/epidemic/index.html
Methodology and Analysis
Healthcare Costs
Table G.2: Healthcare Costs, $ in Millions (2019 Estimates)
| Cost Category | 2019 Mid. Estimate | 2019 Low Estimate | 2019 High Estimate |
| For individuals with OUD | |||
| Commercial | $19,151 | $17,795 | $22,209 |
| Medicare | $25,355 | $23,494 | $31,357 |
| Medicaid | $8,770 | $8,324 | $9,731 |
| Other Public | $555 | $508 | $692 |
| Uninsured | $7,577 | $7,023 | $8,344 |
| Subtotal | $61,407 | $56,944 | $72,332 |
| For family members of individuals with OUD | |||
| Commercial | $1,130 | $1,050 | $1,310 |
| Medicare | $690 | $639 | $853 |
| Medicaid | $517 | $479 | $574 |
| Other Public | $33 | $30 | $41 |
| Uninsured | $447 | $414 | $492 |
| Subtotal | $2,816 | $2,612 | $3,270 |
| For infants born with NAS/NOWS | |||
| Commercial | $97 | $91 | $109 |
| Medicare | N/A | N/A | N/A |
| Medicaid | $695 | $652 | $789 |
| Other Public | $7 | $7 | $8 |
| Uninsured | $66 | $62 | $75 |
| Subtotal | $865 | $812 | $981 |
| Healthcare Total | $65,088 | $60,368 | $76,583 |
To estimate healthcare costs, Davenport, Weaver, and Caverly (2019) used 3 large healthcare claims datasets (IBM Watson Health MarketScan Commercial Claims and Encounters Database, Milliman Consolidated Health Cost Guidelines Sources Database, CMS 5% Sample Standard Analytical Files) to conduct a matched case- control study, comparing the healthcare costs of patients with OUD to similar patients who do not have OUD.
43 https://trumpwhitehouse.archives.gov/articles/full-cost-opioid-crisis-2-5-trillion-four-years/
The 3 datasets covered claims data for those with commercial insurance, Medicaid managed care, Medicare FFS, and Medicare Advantage. Patients with OUD were identified using OUD-related diagnosis codes and patients without OUD were identified using eligible control variables. Claims were also classified into various service categories, including Medication-Assisted Treatment, other opioids, behavioral, and physical.
In addition to performing a cost analysis for individuals with OUD, the authors also performed a similar analysis for individuals with relatives diagnosed with an OUD by examining individuals that share an insurance contract with someone diagnosed with OUD. This analysis was only applicable to the commercial insurance population. Treatment costs for infants born with neonatal abstinence syndrome (NAS) or neonatal opioid withdrawal syndrome (NOWS) were also estimated. Both analyses, involving family members and infants born with NAS/NOWS, were included as part of the estimated healthcare costs as the economic impact of non-medical opioid use also affects family members of those diagnosed with OUD.
Davenport et al. (2019) extrapolated the case-control study costs to the national population using 2015 to 2017 population estimates from the U.S. Census Bureau, and further trended forward population estimates for 2018 and 2019 using the 2015 to 2017 distributions and rates.
Mortality Costs
Table G.3: Mortality Costs, $ in Millions (2019 Estimates)
| Cost Category | 2019 Mid. Estimate | 2019 Low Estimate | 2019 High Estimate |
| Medical costs | $270 | $238 | $304 |
| Lost lifetime earnings | $73,817 | $65,331 | $83,322 |
| Mortality Total | $74,087 | $65,569 | $83,626 |
The CDC has published opioid overdose data via its Morbidity and Mortality Weekly Report for 2015 to 2017 and estimated opioid overdose deaths for 2018. The data is broken down into age group, sex, and state. To estimate opioid overdose deaths for 2019, Davenport et al. (2019) projected mortality rates to remain flat, to decrease, and to increase for a total of 3 possible scenarios reflecting a continuation, improvement, or worsening of the opioid epidemic.
The average cost per death involves the medical costs per death and the lost lifetime earnings per death, both of which the CDC’s Web-based Injury Statistics Query and Reporting System (WISQARS) module was used for. The WISQARS module estimates medical cost per death data by cause of injury, place of death, and age. Lost lifetime earnings are estimated by the net present value of expected annual earnings based on the number of remaining working years, age, and sex, while also accounting for adjusted future earnings. Davenport et al. (2019) then indexed both of these cost estimates from the WISQARS module, which are valued at 2010 prices, through 2019 using the GDP implicit price deflator from the Federal Reserve Bank of St. Louis.
Criminal Justice Costs
Table G.4: Criminal Justice Costs, $ in Millions (2019 Estimates)
| Cost Category | 2019 Mid. Estimate | 2019 Low Estimate | 2019 High Estimate |
| Police protection | $4,761 | $4,349 | $4,920 |
| Legal and adjudication activities | $2,050 | $1,872 | $2,118 |
| Correctional facilities | $4,470 | $4,118 | $4,712 |
| Property lost due to crime | $894 | $846 | $1,004 |
| Criminal Justice Total | $12,175 | $11,185 | $12,754 |
The criminal justice costs in the research published by the Society of Actuaries were broken down into costs for police protecting and legal and adjudication activities, costs of correctional facilities, and costs of property loss due to crime. The cost estimates for police protecting, legal and adjudication activities, and correctional facilities were derived from the annual Justice Expenditure and Employment Extracts published by the Bureau of Justice Statistics. The annualized cost trends for each category between 2013 to 2015 were trended forward to estimate for the time period between 2015 through 2019. Cost estimates for property loss between 2015 and 2017 came from the annual “Crime in the U.S.” reports published by the Federal Bureau of Investigation (FBI). The annualized trend rate for 2015 to 2017 were then used to project estimates for 2018 and 2019.
Davenport et al. (2019) then calculated the opioid cost portion for each of these cost categories separately. The portion of police protection and legal and adjudication costs attributed to non-medical opioid use was determined by first determining the proportion of arrests in the United States that are drug-induced and then applying the proportion of overall illicit drug use that is related to non-medical opioids. A similar method was used to determine the opioid cost apportionment for correctional facilities, but the authors further analyzed by type of correctional facility, including federal, state, and local facilities. The portion of property loss costs related to opioids was estimated using a drug-induced attribution factor for property crime published by the National Drug Intelligence Center (NDIC) and applying the same proportion of overall illicit substance abuse disorder that is attributed to opioid misuse.
Child & Family Assistance Costs
Table G.5: Child & Family Assistance Costs, $ in Millions (2019 Estimates)
| Cost Category | 2019 Mid. Estimate | 2019 Low Estimate | 2019 High Estimate |
| Child welfare | $1,371 | $1,297 | $1,539 |
| Food and nutritional assistance | $2,567 | $2,429 | $2,882 |
| Income assistance | $578 | $547 | $649 |
| Housing / homeless assistance | $3,236 | $3,062 | $3,633 |
| Child & Family Assistance Total | $7,752 | $7,335 | $8,703 |
To estimate the total costs for child and family assistance programs between 2015 and 2017, Davenport et al. (2019) sourced federal child welfare program funding data from the Congressional Research Service, costs for the Supplemental Nutrition Assistance Program (SNAP) from the U.S. Department of Agriculture, cost estimates for Temporary Assistance for Needy Families (TANF) from the Office of Family Assistance, payments data for Social Security Income (SSI) from the Social Security Administration, and spending on housing assistance from the U.S. Data Lab. The annual rates between 2015 and 2017 were trended forward to estimate the total programming costs for 2018 and 2019.
The proportion of federal spending on child and family assistance programs related to substance abuse disorder and addiction in 2009 published by the National Center on Addiction and Substance Abuse (NCASA) and the assumed proportion of total illicit substance abuse disorder that non-medical opioids account for from the National Survey on Drug Use and Health (NSDUH) were then applied to estimate the amount of child and family assistance funding spent on non-medical opioid use.
Education Costs
Table G.7: Productivity Loss Costs, $ in Millions (2019 Estimates)
| Cost Category | 2019 Mid. Estimate | 2019 Low Estimate | 2019 High Estimate |
| Education Total | $1,257 | $1,190 | $1,412 |
The study omits education spending for higher education programs related to substance abuse disorder and addiction due to insufficient data, suggesting lack of substance abuse disorder programs at higher education institutions. Using Common Core of Data reports for federal education expenditure data, Davenport et al. (2019) apply the proportion of federal education spending on substance abuse disorder or addiction from a study by the National Center on Addiction and Substance Abuse (NCASA) and assumptions on the ratio of non- medical opioid use to total illicit substance abuse from the National Survey on Drug Use and Health (NSDUH) to derive estimates for education costs.
Productivity Loss Costs
Table G.7: Productivity Loss Costs, $ in Millions (2019 Estimates)
| Cost Category | 2019 Mid. Estimate | 2019 Low Estimate | 2019 High Estimate |
| Reduced labor force participation and absenteeism | $23,094 | $21,414 | $25,995 |
| Incarceration | $3,909 | $3,600 | $4,120 |
| Short-term disability | $443 | $412 | $514 |
| Long-term disability | $40 | $38 | $47 |
| Workers’ Compensation | $535 | $497 | $621 |
| Productivity Loss Total | $28,022 | $25,961 | $31,296 |
The costs of lost productivity were calculated by determining the costs of reduced working hours related to non-medical opioid use and the costs of incarcerations related to non-medical opioid use.
For the former, individuals can miss employment (absenteeism) or drop out of the labor force due to illicit drug use. Davenport et al. (2019) calculated the prevalence rates of OUD by age and sex using the 3 healthcare claims datasets used to estimate healthcare costs and extrapolated to national population estimates. They multiplied the resulting national OUD estimates with the per-person annual production values by age and sex from Grosse et al. (2009) and indexed for each year using the Federal Reserve Economic Data Implicit GDP Price Deflator. Lastly, the authors applied the proportion of lost productivity attributed to non-medical opioid use published by the National Drug Intelligence Center (NDIC) to estimate productivity loss.
Lost productivity due to incarceration associated with non-medical opioid use was determined using the number of incarcerations attributed to non-medical opioid use as determined for the estimates of criminal justice costs and the per-person annual production values by age and sex from Grosse et al. (2009), indexing and adjusting using the Federal Reserve Economic Data Implicit GDP Price Deflator.
Additionally, there are lost productivity costs taken on my employers, including short-term disability pay, long- term disability pay, and workers’ compensation. To calculate the proportion of these costs borne by employers that are associated with non-medical opioid use, Davenport et al. (2019) used the same matched case-control analysis and data from IBM’s MarketScan Health and Productivity Database to first estimate the total amount of short- and long-term disability pay and workers’ compensation for employees diagnosed with OUD. The distribution of OUD in the commercial insurance population was applied to U.S. Census Bureau data for extrapolation and for deriving the total number of employees with OUD. The assumed proportions of employees with disability pay and workers’ compensation were sourced from the Bureau of Labor Statistics and Employers Insurance Company and by applying these percentages, Davenport et al. (2019) were able to determine the number of employees with OUD that were eligible for each type of benefit. The number of employees with OUD and eligibility for disability pay or workers’ compensation was then multiplied by the additional costs per employee diagnosed with OUD to obtain the non-medical opioid-related costs borne by employers. These costs were then indexed using the Federal Reserve Economic Data GDP Implicit Price Deflator.
Conclusion
The United States faces an ongoing crisis related to substance abuse disorders. While the direct medical costs of this crisis may be the most apparent, our society also absorbs a significantly higher total of indirect and intangible costs related to substance use. We have estimated these costs in order to provide decision makers with a perspective that may help prioritize and direct public resources and attention to this problem.
There are several areas we did not consider in our analysis. For example, we did not look at employee turnover, replacement costs, training for medical professionals, or the impact of presenteeism. We did not address the additional frictional economic costs of higher insurance premiums needed to cover property, auto, health, and life insurance claims related to substance abuse.
We used the most updated data and attribution information that was available. However, some of the information used such as the prescription drug treatment spend may be out of date.
We did not consider the potentially offsetting effects of higher lifetime healthcare and other category expenses for people whose lives are not cut short by substance abuse, choosing to focus on the first- and second-order effects of substance abuse disorder. In addition, we did not address any offsetting “productive” value of the economic activity associated with managing the effects of substance abuse disorder, such as the employment of medical, legal, and social services personnel, and spending on treatment expenses, end of life care costs and other categories. In this, we drew upon a great depth of modern economic thinking44, taking the position that redirecting these economic resources to more productive uses would be a net benefit to our nation.
We hope this analysis will be a valuable tool to put into perspective the vast resources consumed by substance abuse in the United States, and to guide those whose decisions directly affect public and private sector efforts to cope with the economic and social costs of substance abuse and to provide access to treatment.
44 e.g., Frederic Bastiat’s “parable of the broken window” and subsequent analyses from more contemporary sources.
References
- AAMC. (2018). Physician Fee Schedule 2019 Final Rule. Retrieved from https://www.aamc.org/system/files/c/2/493862-aamc-vizient- fpscwebinarslidescy2019medicarephysicianfeeschedul.pdf
- Addiction Center. Cost of Rehab: Paying for Addiction Treatment – Addiction Center. (n.d.).
- Aging. Alcohol Abuse Amongst The Elderly: A Complete Guide. (2019, March 12). Retrieved from https://www.aging.com/alcohol-abuse-amongst-the-elderly-a-complete-guide/
- AidsInfo. Guidelines for the Use of Antiretroviral Agents in Adults and Adolescents with HIV(2019). Retrieved from https://files.aidsinfo.nih.gov/contentfiles/lvguidelines/AdultandAdolescentGL.pdf
- Alcohol & Drug Rehab Cost: Average Cost of Drug Rehab in 2020. (n.d.). Retrieved from http://drughelpline.org/rehab-cost/
- Arias, E., & Xu, J. United States Life Tables, 2017, 68United States Life Tables, 2017 (2019). Retrieved from https://www.cdc.gov/nchs/data/ahcd/namcs_summary/2016_namcs_web_tables.pdf
- Bagchi, A. D., Verdier, J. M., & Simon, S. E. (2010). How Many Nursing Home Residents Live With a Mental Illness? Psychiatric Services, 60(7), 958–964. doi: 10.1176/ps.2009.60.7.958
- Bronson, J., & Carson, E. A. Prisoners in 2017, Prisoners in 2017 (2019). Retrieved from https://www.bjs.gov/content/pub/pdf/p14.pdf
- Bureau of Justice Statistics. Criminal Victimization in the United States, 2008 Statistical Tables, Criminal Victimization in the United States, 2008 Statistical Tables (2010). Retrieved from https://www.bjs.gov/content/pub/pdf/cvus08.pdf
- Bureau of Justice Statistics. Justice Expenditure And Employment Extracts Series. (n.d.). Retrieved from https://www.bjs.gov/index.cfm?ty=pbdc&dcid=286&iid=1
- Bureau of Labor Statistics. CPI Home. (n.d.). Retrieved from https://www.bls.gov/cpi/
- Buvik, K. S., Moan, I. S., & Halkjelsvik, T. S. (2018). Alcohol-related absence and presenteeism: Beyond productivity loss. International Journal of Drug Policy, 58, 71–77. doi: 10.1016/j.drugpo.2018.05.005
- Center on Budget and Policy and Priorities. Policy Basics: The Supplemental Nutrition Assistance Program (SNAP). (2019, June 25). Retrieved from https://www.cbpp.org/research/policy-basics- introduction-to-the-supplemental-nutrition-assistance-program-snap
- Centers for Disease Control and Prevention. (2015, November 6). NNHS – Questionnaires, Datasets, and Related Documentation. Retrieved from https://www.cdc.gov/nchs/nnhs/nnhs_questionnaires.htm
- Centers for Disease Control and Prevention. (2016, March 30). Worker Productivity | Alcohol & Substance Misuse Evaluation Measures. Retrieved from https://www.cdc.gov/workplacehealthpromotion/health-strategies/substance-misuse/evaluation- measures/worker-productivity.html
- Centers for Disease Control and Prevention. (2020, March 19). Understanding the Epidemic. Retrieved from https://www.cdc.gov/drugoverdose/epidemic/index.html
- Centers for Disease Control and Prevention. Diagnoses of HIV Infection in the United States and Dependent Areas, 2018 (2018). Retrieved from https://www.cdc.gov/hiv/pdf/library/reports/surveillance/cdc-hiv-surveillance-report-2018-vol- 30.pdf
- Centers for Disease Control and Prevention. Multiple Cause of Death, 1999-2018 Request. (n.d.). Retrieved from https://wonder.cdc.gov/mcd-icd10.html
- Centers for Disease Control and Prevention. National Hospital Ambulatory Medical Care Survey: 2017 Emergency Department Summary Tables (n.d.). Retrieved from https://www.cdc.gov/nchs/data/nhamcs/web_tables/2017_ed_web_tables-508.pdf
- Centers for Disease Control and Prevention. Underlying Cause of Death, 1999-2018 Request. (n.d.). Retrieved from https://wonder.cdc.gov/ucd-icd10.html
- Centers for Disease Control and Prevention. Viral Hepatitis Surveillance, Viral Hepatitis Surveillance (n.d.). Retrieved from https://www.cdc.gov/hepatitis/statistics/SurveillanceRpts.htm
- Centers for Disease Control and Prevention. HIV Cost-effectiveness, HIV Cost-effectiveness (n.d.). Retrieved from https://www.cdc.gov/hiv/programresources/guidance/costeffectiveness/index.html
- Centers for Disease Control and Prevention. HIV in the United States by Region, HIV in the United States by Region (n.d.). Retrieved from https://www.cdc.gov/hiv/statistics/overview/geographicdistribution.html
- Centers for Disease Control and Prevention. National Ambulatory Medical Care Survey: 2016 National Summary Tables (n.d.). Retrieved from https://www.cdc.gov/nchs/data/ahcd/namcs_summary/2016_namcs_web_tables.pdf
- Centers for Medicare & Medicaid Services. (n.d.). Projected. Retrieved from https://www.cms.gov/Research-Statistics-Data-and-Systems/Statistics-Trends-and-Reports/NationalHealthExpendData/NationalHealthAccountsProjected
- Centers for Medicare & Medicaid Services. Medicare’s Ground Ambulance Data Collection System: Sampling and Instrument Considerations and Recommendations (2019). Retrieved from https://www.cms.gov/Medicare/Medicare-Fee-for-Service-Payment/AmbulanceFeeSchedule/Downloads/Ground-Ambulance-Data-Collection-System- Sampling-Instrument-Considerations-Recommendations.pdf
- Centers for Medicare & Medicaid Services. National Health Expenditures 2017 Highlights (n.d.). Retrieved from https://www.cms.gov/Research-Statistics-Data-and-Systems/Statistics-Trends-and-Reports/NationalHealthExpendData/Downloads/highlights.pdf
- Centers for Medicare & Medicaid Services. Quick Definitions for National Health Expenditure Accounts (NHEA) Categories (n.d.). Retrieved from https://www.cms.gov/files/document/quick-reference-national-health-expenditure-category-definitions-0
- Cherney, K. (n.d.). Hepatitis C in the U.S. Retrieved from https://www.healthline.com/health/hepatitis-c/hepatitis-c-in-the-united-states
- Collins, D. J., & Lapsley, H. M. (2008). The avoidable costs of alcohol abuse in Australia and the potential benefits of effective policies to reduce the social costs of alcohol. PsycEXTRA Dataset. doi: 10.1037/e674302010-001
- Council of Economic Advisers. The Full Cost of the Opioid Crisis: $2.5 Trillion Over Four Years, The Full Cost of the Opioid Crisis: $2.5 Trillion Over Four Years (2019). Retrieved from https://www.whitehouse.gov/articles/full-cost-opioid-crisis-2-5-trillion-four-years/
- Craddock, A., Collins, J. J., & Timrots, A. D. Fact Sheet: Drug-Related Crime, Fact Sheet: Drug-Related Crime (1994). Retrieved from https://www.bjs.gov/content/pub/pdf/DRRC.PDF
- Department of Transportation. Revised Departmental Guidance 2016: Treatment of the Value of Preventing Fatalities and Injuries in Preparing Economic Analyses (2016). Retrieved from https://cms8.dot.gov/sites/dot.gov/files/docs/2016 Revised Value of a Statistical Life Guidance.pdf
- Dillen, C. V., & Kim, S. H. (2017). Unnecessary emergency medical services transport associated with alcohol intoxication. Journal of International Medical Research, 46(1), 33–43. doi: 10.1177/0300060517718116
- Duncan, E. A. S., Best, C., Dougall, N., Skar, S., Evans, J., Corfield, A. R., … Wojcik, W. (2019). Epidemiology of emergency ambulance service calls related to mental health problems and self harm: a national record linkage study. Scandinavian Journal of Trauma, Resuscitation and Emergency Medicine, 27(1). doi: 10.1186/s13049-019-0611-9
- Giving USA 2019: Americans gave $427.71 billion to charity in 2018 amid complex year for charitable giving: Giving USA. (2019, June 18). Retrieved from https://givingusa.org/giving-usa- 2019-americans-gave-427-71-billion-to-charity-in-2018-amid-complex-year-for-charitable-giving/
- Goplerud, E., Hodge, S., & Benham, T. (2017). A Substance Use Cost Calculator for US Employers With an Emphasis on Prescription Pain Medication Misuse. Journal of Occupational and Environmental Medicine, 59(11), 1063–1071. doi: 10.1097/jom.0000000000001157
- Greenmyer, J. R., Klug, M. G., Kambeitz, C., Popova, S., & Burd, L. (2018). A Multicountry Updated Assessment of the Economic Impact of Fetal Alcohol Spectrum Disorder. Journal of Addiction Medicine, 12(6), 466–473. doi: 10.1097/adm.0000000000000438
- Grosse, S. D., Krueger, K. V., & Mvundura, M. (2009). Economic Productivity by Age and Sex. Medical Care, 47(Supplement). doi: 10.1097/mlr.0b013e31819c9571
- Guroo. (n.d.). Guroo. Retrieved from https://www.guroo.com/#!
- Hasselt, M. V., Keyes, V., Bray, J., & Miller, T. (2015). Prescription Drug Abuse and Workplace Absenteeism: Evidence from the 2008–2012 National Survey on Drug Use and Health. Journal of Workplace Behavioral Health, 30(4), 379–392. doi: 10.1080/15555240.2015.1047499
- HCUP Databases. Healthcare Cost and Utilization Project (HCUP). 2017. Agency for Healthcare Research and Quality, Rockville, MD. Retrieved from www.hcup-us.ahrq.gov/databases.jsp.
- Health Care Cost Institute. (2020). 2018 Health Care Cost and Utilization Report. Retrieved from https://healthcostinstitute.org/images/pdfs/HCCI_2018_Health_Care_Cost_and_Utilization_Report.pdf
- HIV.gov. U.S. Statistics (2020). Retrieved from https://www.hiv.gov/hiv-basics/overview/data-and-trends/statistics
- Institute of Alcohol Studies. Alcohol’s impact on emergency services, Alcohol’s impact on emergency services (2015). Retrieved from http://www.ias.org.uk/uploads/Alcohols_impact_on_emergency_services_full_report.pdf
- IQVIA. (2019). Medicine Use and Spending in the U.S.: A Review of 2018 and Outlook to 2023. IQVIA. Retrieved from https://www.iqvia.com/insights/the-iqvia-institute/reports/medicine-use-and-spending-in-the-us-a-review-of-2018-and-outlook-to-2023
- IRS. Exempt Organizations Business Master File Extract (EO BMF). (2020, March 9). Retrieved from https://www.irs.gov/charities-non-profits/exempt-organizations-business-master-file-extract-eo-bmf
- Kloter, A. Emergency Medical Services Data Report 2016, Emergency Medical Services Data Report 2016 (2016). Retrieved from https://portal.ct.gov/-/media/Departments-and- Agencies/DPH/dph/ems/pdf/CEMSTARS/2016OEMSAnnualDataReportpublic.pdf?la=en
- Kniesner, T. J., & Viscusi, W. K. (2019). The Value of a Statistical Life. SSRN Electronic Journal. doi: 10.2139/ssrn.3379967
- Leubsdorf, B. (2005, February 24). 23% of EMS calls alcohol-related. Retrieved from https://www.browndailyherald.com/2005/02/24/23-of-ems-calls-alcoholrelated/
- Martin, N., Newbury-Birch, D., Duckett, J. et al (2012), A Retrospective Analysis of the Nature, Extent and Cost of Alcohol-Related Emergency Calls to the Ambulance Service in an English Region. Alcohol and Alcoholism 47:2, pp191-197
- Mccollister, K. E., French, M. T., & Fang, H. (2010). The cost of crime to society: New crime-specific estimates for policy and program evaluation. Drug and Alcohol Dependence, 108(1-2), 98–109. doi: 10.1016/j.drugalcdep.2009.12.002
- Mjelde-Mossey, L. A. (2007). Alcoholism Treatment in a Nursing Home. Alcoholism Treatment Quarterly, 25(3), 87–98. doi: 10.1300/j020v25n03_07
- Morgan, R. E., & Oudekerk, B. A. Criminal Victimization, 2018, Criminal Victimization, 2018 (2019). Retrieved from https://www.bjs.gov/content/pub/pdf/cv18.pdf
- Nall, R., Hollan, K., & Cherney, K. (n.d.). Current prescription drug costs. Retrieved from https://www.healthline.com/health/hiv-aids/cost-of-treatment
- National Association of State Alcohol and Drug Abuse Directors. Substance Abuse Prevention and Treatment (SAPT) Block Grant (2019). Retrieved from https://nasadad.org/wp- content/uploads/2019/03/SAPT-Block-Grant-Fact-Sheet-March-2019.pdf
- National Center for State Courts. (n.d.). National Overview. Retrieved from http://www.courtstatistics.org/NCSC-Analysis/National-Overview.aspx
- National Center on Substance Abuse and Child Welfare. Child Welfare and Alcohol & Drug Use Statistics. (n.d.). Retrieved from https://ncsacw.samhsa.gov/research/child-welfare-and-treatment- statistics.aspx
- National Fire Protection Association. (2017). Total Cost of Fire in the United States. Retrieved from https://www.nfpa.org/-/media/Files/News-and-Research/Fire-statistics-and-reports/US-Fire-Problem/RFTotalCost.pdf
- National Fire Protection Association. (2019). Home Structure Fires. Retrieved from https://www.nfpa.org/-/media/Files/News-and-Research/Fire-statistics-and-reports/Building-and-life-safety/oshomes.pdf
- National Highway Traffic Safety Administration, Blincoe, L. J., Miller, T. R., Zaloshnja, E., & Lawrence, B. A. (2015, May). The economic and societal impact of motor vehicle crashes, 2010. (Revised) (Report No. DOT HS 812 013). Washington, DC: National Highway Traffic Safety Administration.
- National Highway Traffic Safety Administration, Traffic Safety Facts 2017 (2019). Retrieved from https://crashstats.nhtsa.dot.gov/Api/Public/ViewPublication/812806
- National Institute of Justice, Harwood, H. J., Napolitano, D. M., Kristiansen, P. L., & Collins, J. J. Economic Costs to Society of Alcohol and Drug Abuse and Mental Illness: 1980, Economic Costs to Society of Alcohol and Drug Abuse and Mental Illness: 1980 (n.d.). Retrieved from https://www.ncjrs.gov/pdffiles1/Digitization/117820NCJRS.pdf
- National Institute on Drug Abuse. (1998, September 1). The Economic Costs of Alcohol and Drug Abuse in the United States – 1992. Retrieved from https://archives.drugabuse.gov/publications/economic-costs-alcohol-drug-abuse-in-united-states-1992
- National Safety Council. (n.d.). Implications of Drug and Alcohol Use for Employers. Retrieved from https://www.nsc.org/work-safety/safety-topics/drugs-at-work/substances
- Office of National Drug Control Policy. National Drug Control Strategy – FY2020 Performance Summary (2019). Retrieved from https://www.whitehouse.gov/wp-content/uploads/2019/05/FY-2019-Budget-Summary-FINAL.pdf
- Office of the Administration for Children & Families. TANF Financial Data – FY 2018 (2019). Retrieved from https://www.acf.hhs.gov/ofa/resource/tanf-financial-data-fy-2018
- Owens, P. L., Fingar, K. R., McDermott, K. W., Muhuri, P. K., & Heslin, K. C. Inpatient Stays Involving Mental and Substance Use Disorders, 2016, inpatient Stays Involving Mental and Substance Use Disorders, 2016 (2019). Retrieved from https://www.hcup-us.ahrq.gov/reports/statbriefs/sb249-Mental-Substance-Use-Disorder-Hospital-Stays-2016.pdf
- Rosinsky, K., & Williams, S. C. (2018). Child Welfare Financing SFY 2016: A survey of federal, state, and local expenditures. Child Trends. Retrieved from https://www.childtrends.org/wp-content/uploads/2018/12/CWFSReportSFY2016_ChildTrends_December2018.pdf
- Shatter Proof. (n.d.). A Substance Use Cost Calculator for Employers – Methodology. Retrieved from https://www.shatterproof.org/sites/default/files/2017-03/A-Substance-Use-Cost-Calculator-For-Employers-Methodology_0.pdf?mod=article_inline
- Single, E., Collins, D., Lapsley, H., Brochu, S., Easton, B., Perez-Gomze, A., & Rehm, J. (2006). International Guidelines for Estimating the Costs of Substance Abuse. Retrieved from https://oraprdnt.uqtr.uquebec.ca/pls/public/docs/FWG/GSC/Publication/4242/60/5333/1/6126 1/5/F1234461959_2006_Brochu_costs_SPA.pdf
- Society of Actuaries. (2019). Economic Impact of Non-Medical Opioid in the United States. Retrieved from https://www.soa.org/globalassets/assets/files/resources/research-report/2019/econ-impact-non-medical-opioid-use.pdf
- Substance Abuse and Mental Health Services Administration. (1997). A Guide to Substance Abuse Services for Primary Care Clinicians. Retrieved from https://www.ncbi.nlm.nih.gov/books/NBK64831/
- Substance Abuse and Mental Health Services Administration. (n.d.). National Survey on Drug Use and Health (NSDUH). Retrieved from https://www.datafiles.samhsa.gov/study-series/national-survey-drug-use-and-health-nsduh-nid13517
- Substance Abuse and Mental Health Services Administration. Current Statistics on the Prevalence and Characteristics of People Experiencing Homelessness in the United States (n.d.). Retrieved from https://www.samhsa.gov/sites/default/files/programs_campaigns/homelessness_programs_resources/hrc-factsheet-current-statistics-prevalence-characteristics-homelessness.pdf
- Substance Abuse and Mental Health Services Administration. Key Substance Use and Mental Health Indicators in the United States: Results from the 2018 National Survey on Drug Use and Health (2019). Retrieved from https://www.samhsa.gov/data/sites/default/files/cbhsq-reports/NSDUHNationalFindingsReport2018/NSDUHNationalFindingsReport2018.pdf
- Substance Abuse and Mental Health Services Administration. National Survey of Substance Abuse Treatment Services (2015-2018). Retrieved from https://wwwdasis.samhsa.gov/dasis2/nssats.htm
- Substance Abuse and Mental Health Services Administration. National Survey on Drug Use and Health (NSDUH) (2015-2018.). Retrieved from https://www.samhsa.gov/data/sites/default/files/cbhsq-reports/2017_NSSATS.pdf
- Substance Abuse and Mental Health Services Administration. Projections of National Expenditures for Treatment of Mental and Substance Use Disorders, 2010-2020 (2014). Rockville, MD.
- The Lewin Group. Economic Costs of Excessive Alcohol Consumption in the United States, 2006 (2013). Retrieved from http://www.lewin.com/content/dam/Lewin/Resources/Site_Sections/Publications/CDC_Report_Rev.pdf
- U.S. Bureau of Economic Analysis. Interactive Access to Industry Economic Accounts Data: GDP by Industry. (n.d.).
- U.S. Bureau of Labor Statistics. A look at consolidated leave plans in 2018, A look at consolidated leave plans in 2018 (n.d.). Retrieved from https://www.bls.gov/opub/ted/2019/a-look-at-consolidated-leave-plans-in-2018.htm
- U.S. Bureau of Labor Statistics. American Time Use Survey — 2018 RESULTS, American Time Use Survey — 2018 RESULTS (n.d.). Retrieved from https://www.bls.gov/news.release/pdf/atus.pdf
- U.S. Bureau of Labor Statistics. Average hours per day spent in selected activities by age, men. (n.d.). Retrieved from https://www.bls.gov/charts/american-time-use/activity-by-agem.htm
- U.S. Bureau of Labor Statistics. Average hours per day spent in selected activities by age, women. (n.d.). Retrieved from https://www.bls.gov/charts/american-time-use/activity-by-agew.htm
- U.S. Bureau of Labor Statistics. Employer Costs For Employee Compensation – December 2019, Employer Costs For Employee Compensation – December 2019 (n.d.). Retrieved from https://www.bls.gov/news.release/pdf/ecec.pdf
- U.S. Bureau of Labor Statistics. Labor Force Statistics from the Current Population Survey, Labor Force Statistics from the Current Population Survey (n.d.).
- U.S. Bureau of Labor Statistics. May 2017 Occupational Employment and Wage Estimates, May 2017 Occupational Employment and Wage Estimates (n.d.). Retrieved from https://www.bls.gov/oes/2017/may/naics4_561600.htm#41-0000
- U.S. Bureau of Labor Statistics. May 2018 Occupational Employment and Wage Estimates, May 2018 Occupational Employment and Wage Estimates (n.d.). Retrieved from https://www.bls.gov/oes/2018/may/naics4_561600.htm#41-0000
- U.S. Bureau of Labor Statistics. May 2019 Occupational Employment and Wage Estimates, May 2019 Occupational Employment and Wage Estimates (n.d.). https://www.bls.gov/oes/current/oes372012.htm
- U.S. Bureau of Labor Statistics. Security Guards and Gaming Surveillance Officers. (n.d.). Retrieved from https://www.bls.gov/ooh/protective-service/security-guards.htm#tab-5
- U.S. Bureau of Labor Statistics. Usual Weekly Earnings of Wage and Salary Workers Archived News Releases (n.d.). Retrieved from https://www.bls.gov/bls/news-release/wkyeng.htm#2019
- U.S. Census Bureau. 2018 Government Employment and Payroll Tables. (2019, June 19). Retrieved from https://www.census.gov/data/tables/2018/econ/apes/annual-apes.html
- U.S. Census Bureau. Characteristics of the Group Quarters Population by Group Quarters Type (5 Types). (n.d.). Retrieved from https://data.census.gov/cedsci/table?q=CHARACTERISTICS OF THE GROUP QUARTERS POPULATION BY GROUP QUARTERS TYPE (5 TYPES)&hidePreview=true&tid=ACSST1Y2018.S2603&vintage=2018
- U.S. Courts. Judicial Business 2019. (n.d.). Retrieved from https://www.uscourts.gov/statistics-reports/judicial-business-2019
- U.S. Department of Justice. United States Attorneys’ Annual Statistical Report, United States Attorneys’ Annual Statistical Report (n.d.). Retrieved from https://www.justice.gov/usao/page/file/1199336/download
- U.S. Department of Veterans Affairs. FY 2019 Budget Submission (n.d.). Retrieved from https://www.va.gov/budget/products.asp
- U.S. Environmental Protection Agency. Mortality Risk Valuation. (2018, February 8). Retrieved from https://www.epa.gov/environmental-economics/mortality-risk-valuation
- U.S. Social Security Administration. Annual Report of the Supplemental Security Income Program (n.d.). Retrieved from https://www.ssa.gov/OACT/ssir/SSI19/ssi2019.pdf
- U.S. Social Security Administration. Social Security Administrative Expenses. (n.d.). Retrieved from https://www.ssa.gov/oact/STATS/admin.htm
- UNAIDS. (n.d.). Face Sheet– World Aids Day 2019. Retrieved from https://www.unaids.org/sites/default/files/media_asset/UNAIDS_FactSheet_en.pdf
- Uniform Crime Reports. Crime in the U.S. (n.d.). Retrieved from https://ucr.fbi.gov/crime-in-the-u.s
- United States Sentencing Commission. (n.d.). Fiscal Year 2018 Overview of Federal Criminal Cases. Retrieved from https://www.ussc.gov/sites/default/files/pdf/research-and-publications/research-publications/2019/FY18_Overview_Federal_Criminal_Cases.pdf
- US Census Bureau. (2020, March 26). National Population Totals: 2010-2019. Retrieved from https://www.census.gov/data/tables/time-series/demo/popest/2010s-national-total.html
- US Census Bureau. 2017 National Population Projections Datasets. (2020, February 20). Retrieved from https://www.census.gov/data/datasets/2017/demo/popproj/2017-popproj.html
- Working days. (n.d.). Retrieved from https://www.workingdays.us/workingdays_holidays_2019.htm
- Wu, L.-T., Mcneely, J., Subramaniam, G. A., Brady, K. T., Sharma, G., Vanveldhuisen, P., … Schwartz, R. P. (2017). DSM-5 substance use disorders among adult primary care patients: Results from a multisite study. Drug and Alcohol Dependence, 179, 42–46. doi: 10.1016/j.drugalcdep.2017.05.048